
If you're like most organizations, you probably didn't start using Power BI with any grand ambitions. People across the business just needed better visibility: a few dashboards, some key metrics, maybe a cleaner picture of what was coming out of the ERP or living in a tangle of spreadsheets. So, they downloaded Power BI Desktop, connected it to a few data sources, and started building reports.
There’s nothing inherently wrong with this approach. In many ways, it’s exactly why Power BI took off in the first place. It made BI accessible to a much broader audience, especially business analysts who were accustomed to working in Excel and trying to stitch things together on their own. It gave teams a faster, more approachable way to get answers from their data.
Over time, though, this approach tends to become unwieldy. As more reports are built and more datasets are layered in, maintenance becomes more challenging. Report by report and dataset by dataset, Power BI starts to take on a role nobody really planned for. Data from across the business flows through it, teams rely on it every day, and it gradually becomes the place where the organization makes sense of itself.
This shift from convenience to infrastructure is when the bigger questions start to surface. Is Power BI still the right foundation, or is it time to think about transitioning BI workloads to a more comprehensive data platform like Microsoft Fabric? In this article, we'll help you work through that decision in practical terms, including what Fabric actually offers, where it makes sense, and where the juice might not (yet) be worth the squeeze.
The Accidental Data Platform
As the name suggests, Microsoft Power BI is a cloud-based business intelligence service designed to help organizations make sense of their data. At a basic level, it connects to data from across your business, pulls it together, and turns it into reports and dashboards that people can actually use.
What sets Power BI apart from traditional enterprise BI platforms is how quickly you can get started. Legacy tools often required significant infrastructure investment, dedicated data engineering resources, and months of setup before anyone could run a meaningful report. Power BI flips that model. A business analyst with a few spreadsheets on their desktop or in OneDrive can conceivably build a working dashboard in an afternoon, without submitting an IT ticket, standing up a data warehouse, or committing to a six-figure implementation project.
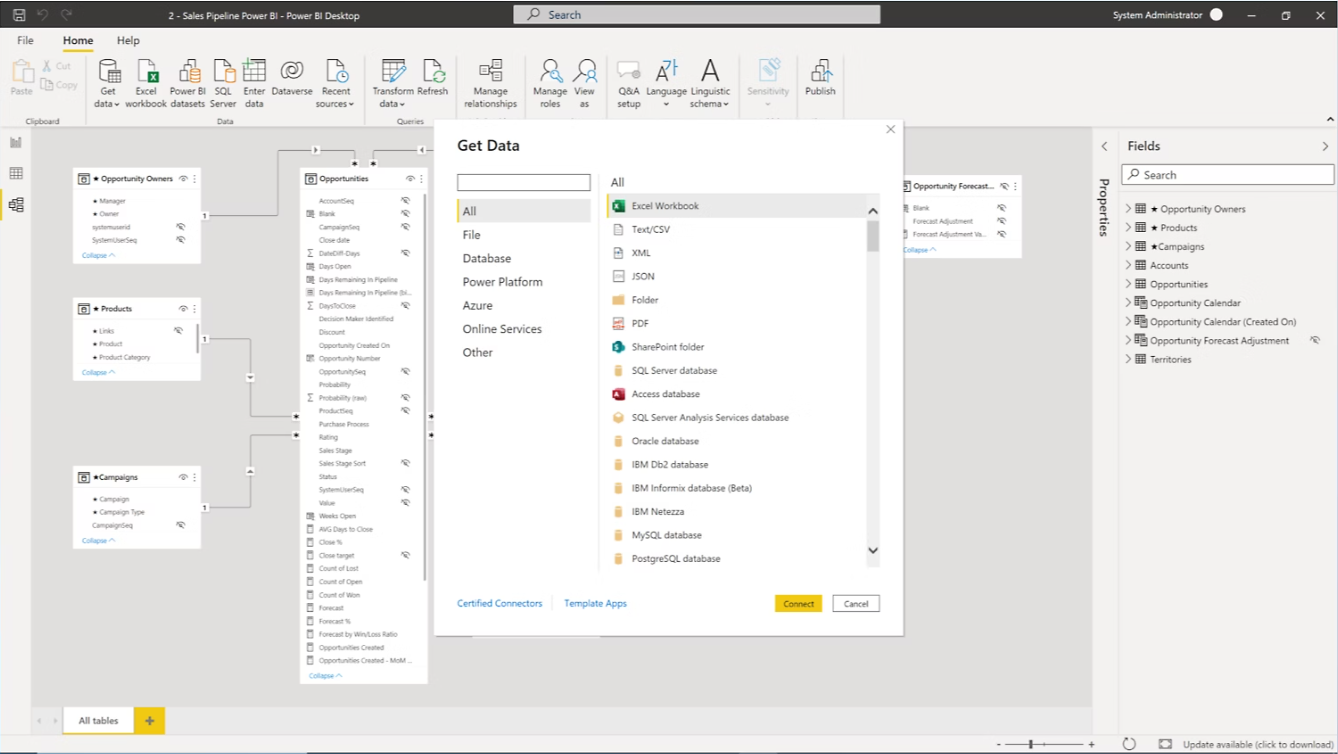
Figure 1: Loading Data from an Excel Spreadsheet into a Power BI Report
While the simplicity of Power BI makes it easy for users from both technical and non-technical backgrounds to get up and running quickly, part of what makes it so approachable is that it goes beyond just visualization. Microsoft extended Power BI to include built-in lightweight data integration and modeling capabilities, giving users the ability to pull in data, clean it up, and shape it into something usable without needing a full data engineering stack.
It All Started in Excel (Like Most Things Do)
Long before Power BI became a standalone platform, a lot of what it does today was already taking shape inside Microsoft Excel.
For years, Excel was the default tool for business analysts trying to make sense of data. Pivot tables, formulas, and charts were the building blocks. If you needed to answer a question, you pulled data into a spreadsheet, organized it, and built something that worked. It wasn’t always elegant, but it was familiar, flexible, and good enough to get the job done.
Microsoft really leaned into that reality. Instead of forcing users to learn an entirely new way of thinking, they built on top of concepts analysts already understood. The idea of slicing and dicing data, defining relationships, creating calculated fields, and organizing information into something meaningful all carried forward. What changed was the scale and the structure around it.
Power BI took those familiar patterns and gave them a more formal home. Models became more robust. Calculations became more reusable. Reports became easier to share. But at its core, the experience still feels recognizable to anyone who has spent time working in Excel.
That continuity is a big part of why adoption happened so quickly. Power BI did not ask users to start over. It met them where they were, extended what they already knew, and made it easier to take the next step.
The only downside to this approach is that techniques that work well in Excel don't always scale particularly well as businesses grow and there's more cooks in the kitchen looking at the data.
More Than Just a Visualization Tool
As noted earlier, Power BI brings several key pieces of the analytics workflow into a single experience, which makes it much easier for business users to go from raw data to insight without relying on multiple tools.
Using graphical development tools like the Power BI Desktop application, users can run through simple wizards to create extract, transform, and load (ETL) pipelines that pull in data from a variety of sources and shape it using Power Query. They can point and click to define relationships between datasets and build reusable models. And with DAX (and its good friend Copilot), they can create fairly sophisticated calculations that capture business logic directly within the model.
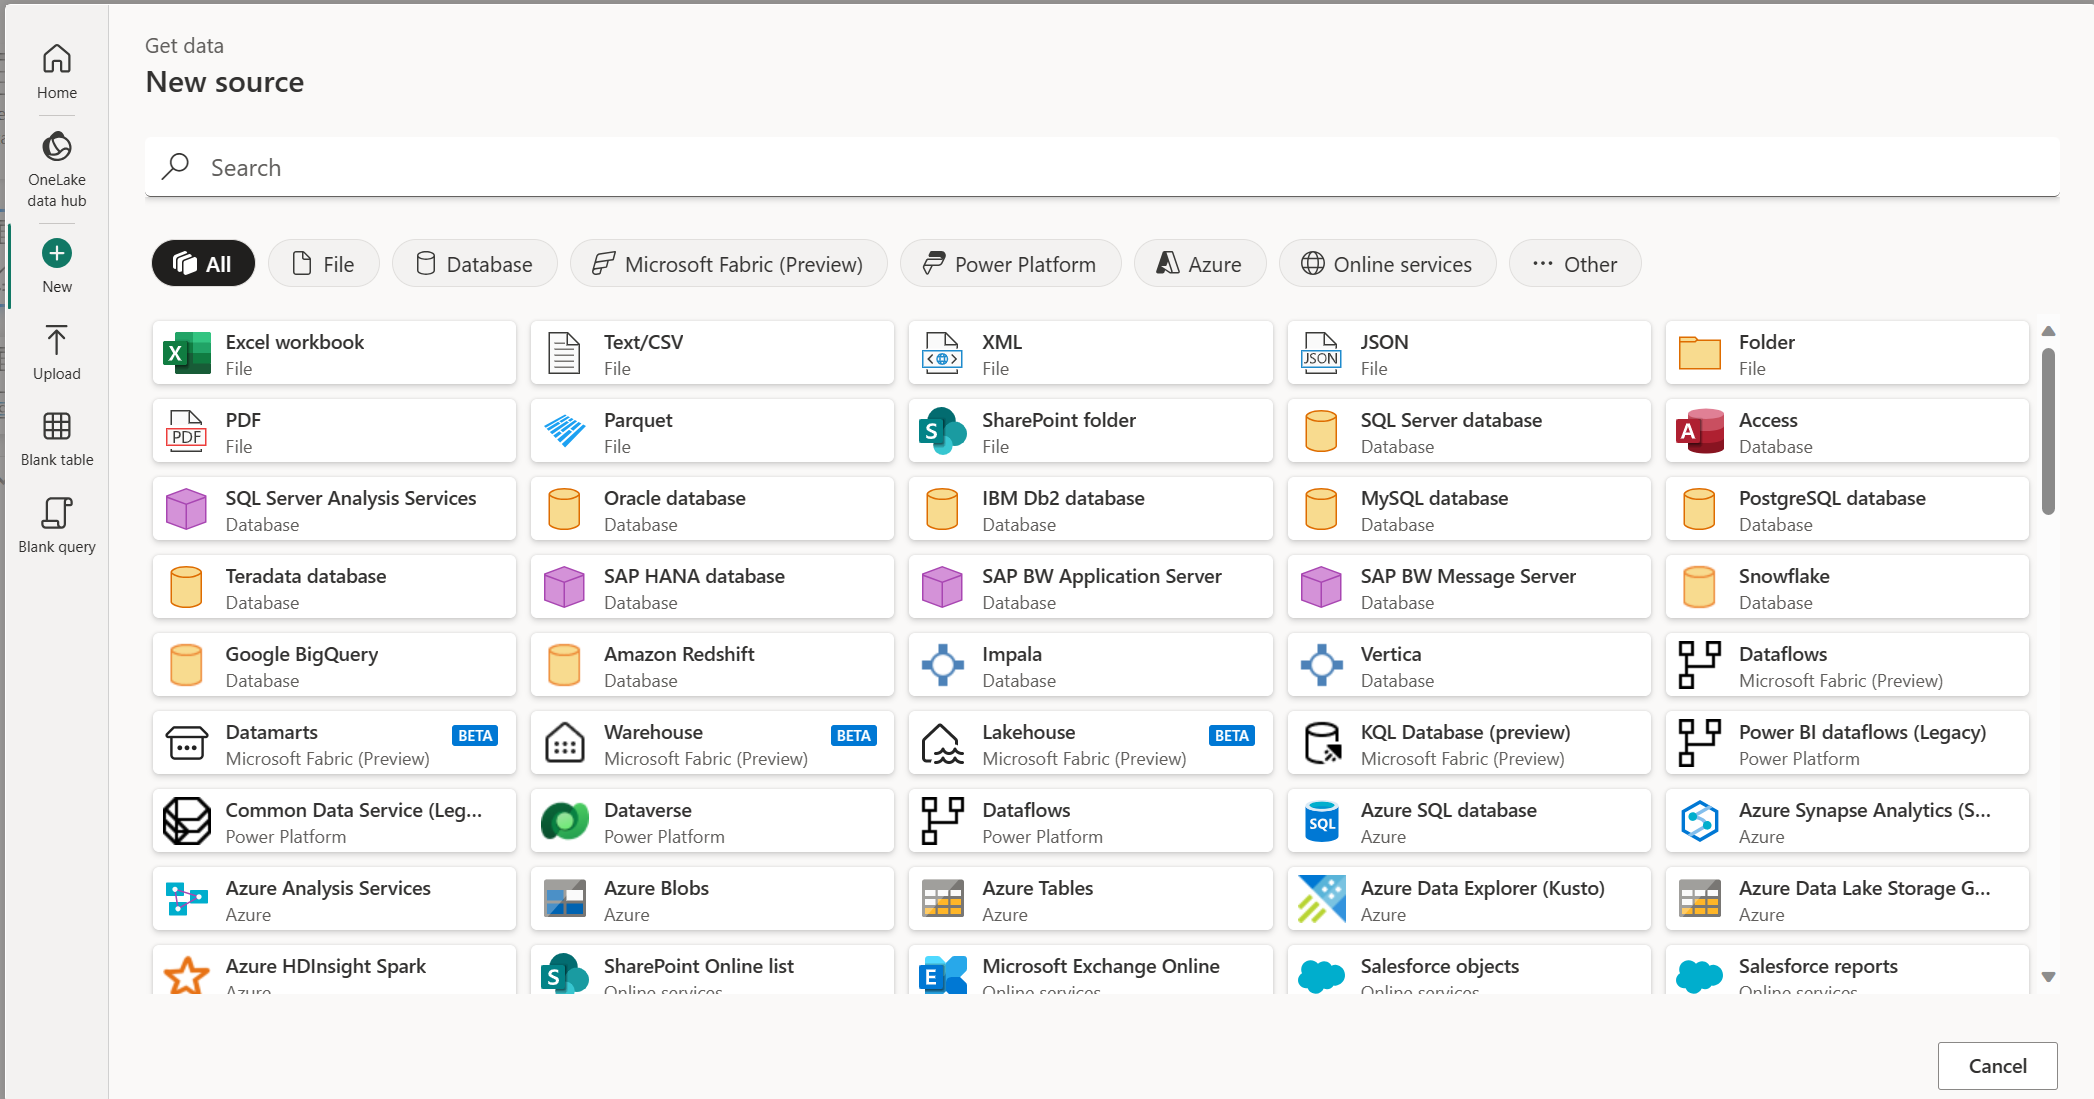
Figure 2: Building Data Flows using Power Query
That combination is powerful. It allows business analysts to move from raw data to insight in a single tool, often without waiting on other teams. It also means that many of the steps traditionally handled by separate systems are now happening inside Power BI itself.
However, once again, that convenience can be a double-edged sword.
As data volumes grow and more complex systems enter the picture, the limits of these tools start to show. Data models become harder to manage. Calculations become more difficult to maintain. Data refreshes take longer and are more prone to failure. What worked well for a handful of reports and relatively simple data sources can begin to struggle under the weight of enterprise-scale requirements.
This is especially true when data is coming from systems like ERP, CRM, and other line-of-business applications, where structure, scale, and consistency matter more. At that point, Power BI is no longer just helping visualize the business: it's trying to act as the system that organizes and prepares the data itself, and that's not really what it was designed to do.
Behind the Dashboard: What’s Really Powering Power BI
As we noted earlier, Power BI is positioned by Microsoft as a service. That distinction is easy to overlook because most casual users interact with it through familiar tools like the Power BI Desktop app. But in reality, it works much more like Microsoft 365 (formerly known as Office 365) than a standalone piece of software.
When people think about Microsoft 365, they tend to picture apps like Word, Excel, Outlook, and PowerPoint. What often gets less attention are the services working behind the scenes, like SharePoint, OneDrive, and Microsoft Exchange, which handle storage, sharing, and communication and make those apps function as part of a connected system.
Power BI follows a very similar pattern. While many users spend most of their time in the Power BI Desktop application building reports, the heavy lifting at runtime happens in the cloud within the Power BI Service.
As you can see in Figure 3 below, the Power BI Service is where data is uploaded and stored, where reports are hosted and shared, and where the underlying infrastructure processes queries and delivers the interactive experience users rely on. In other words, the Power BI Desktop app may be where reports are created, but the Power BI Service is what actually makes them run.
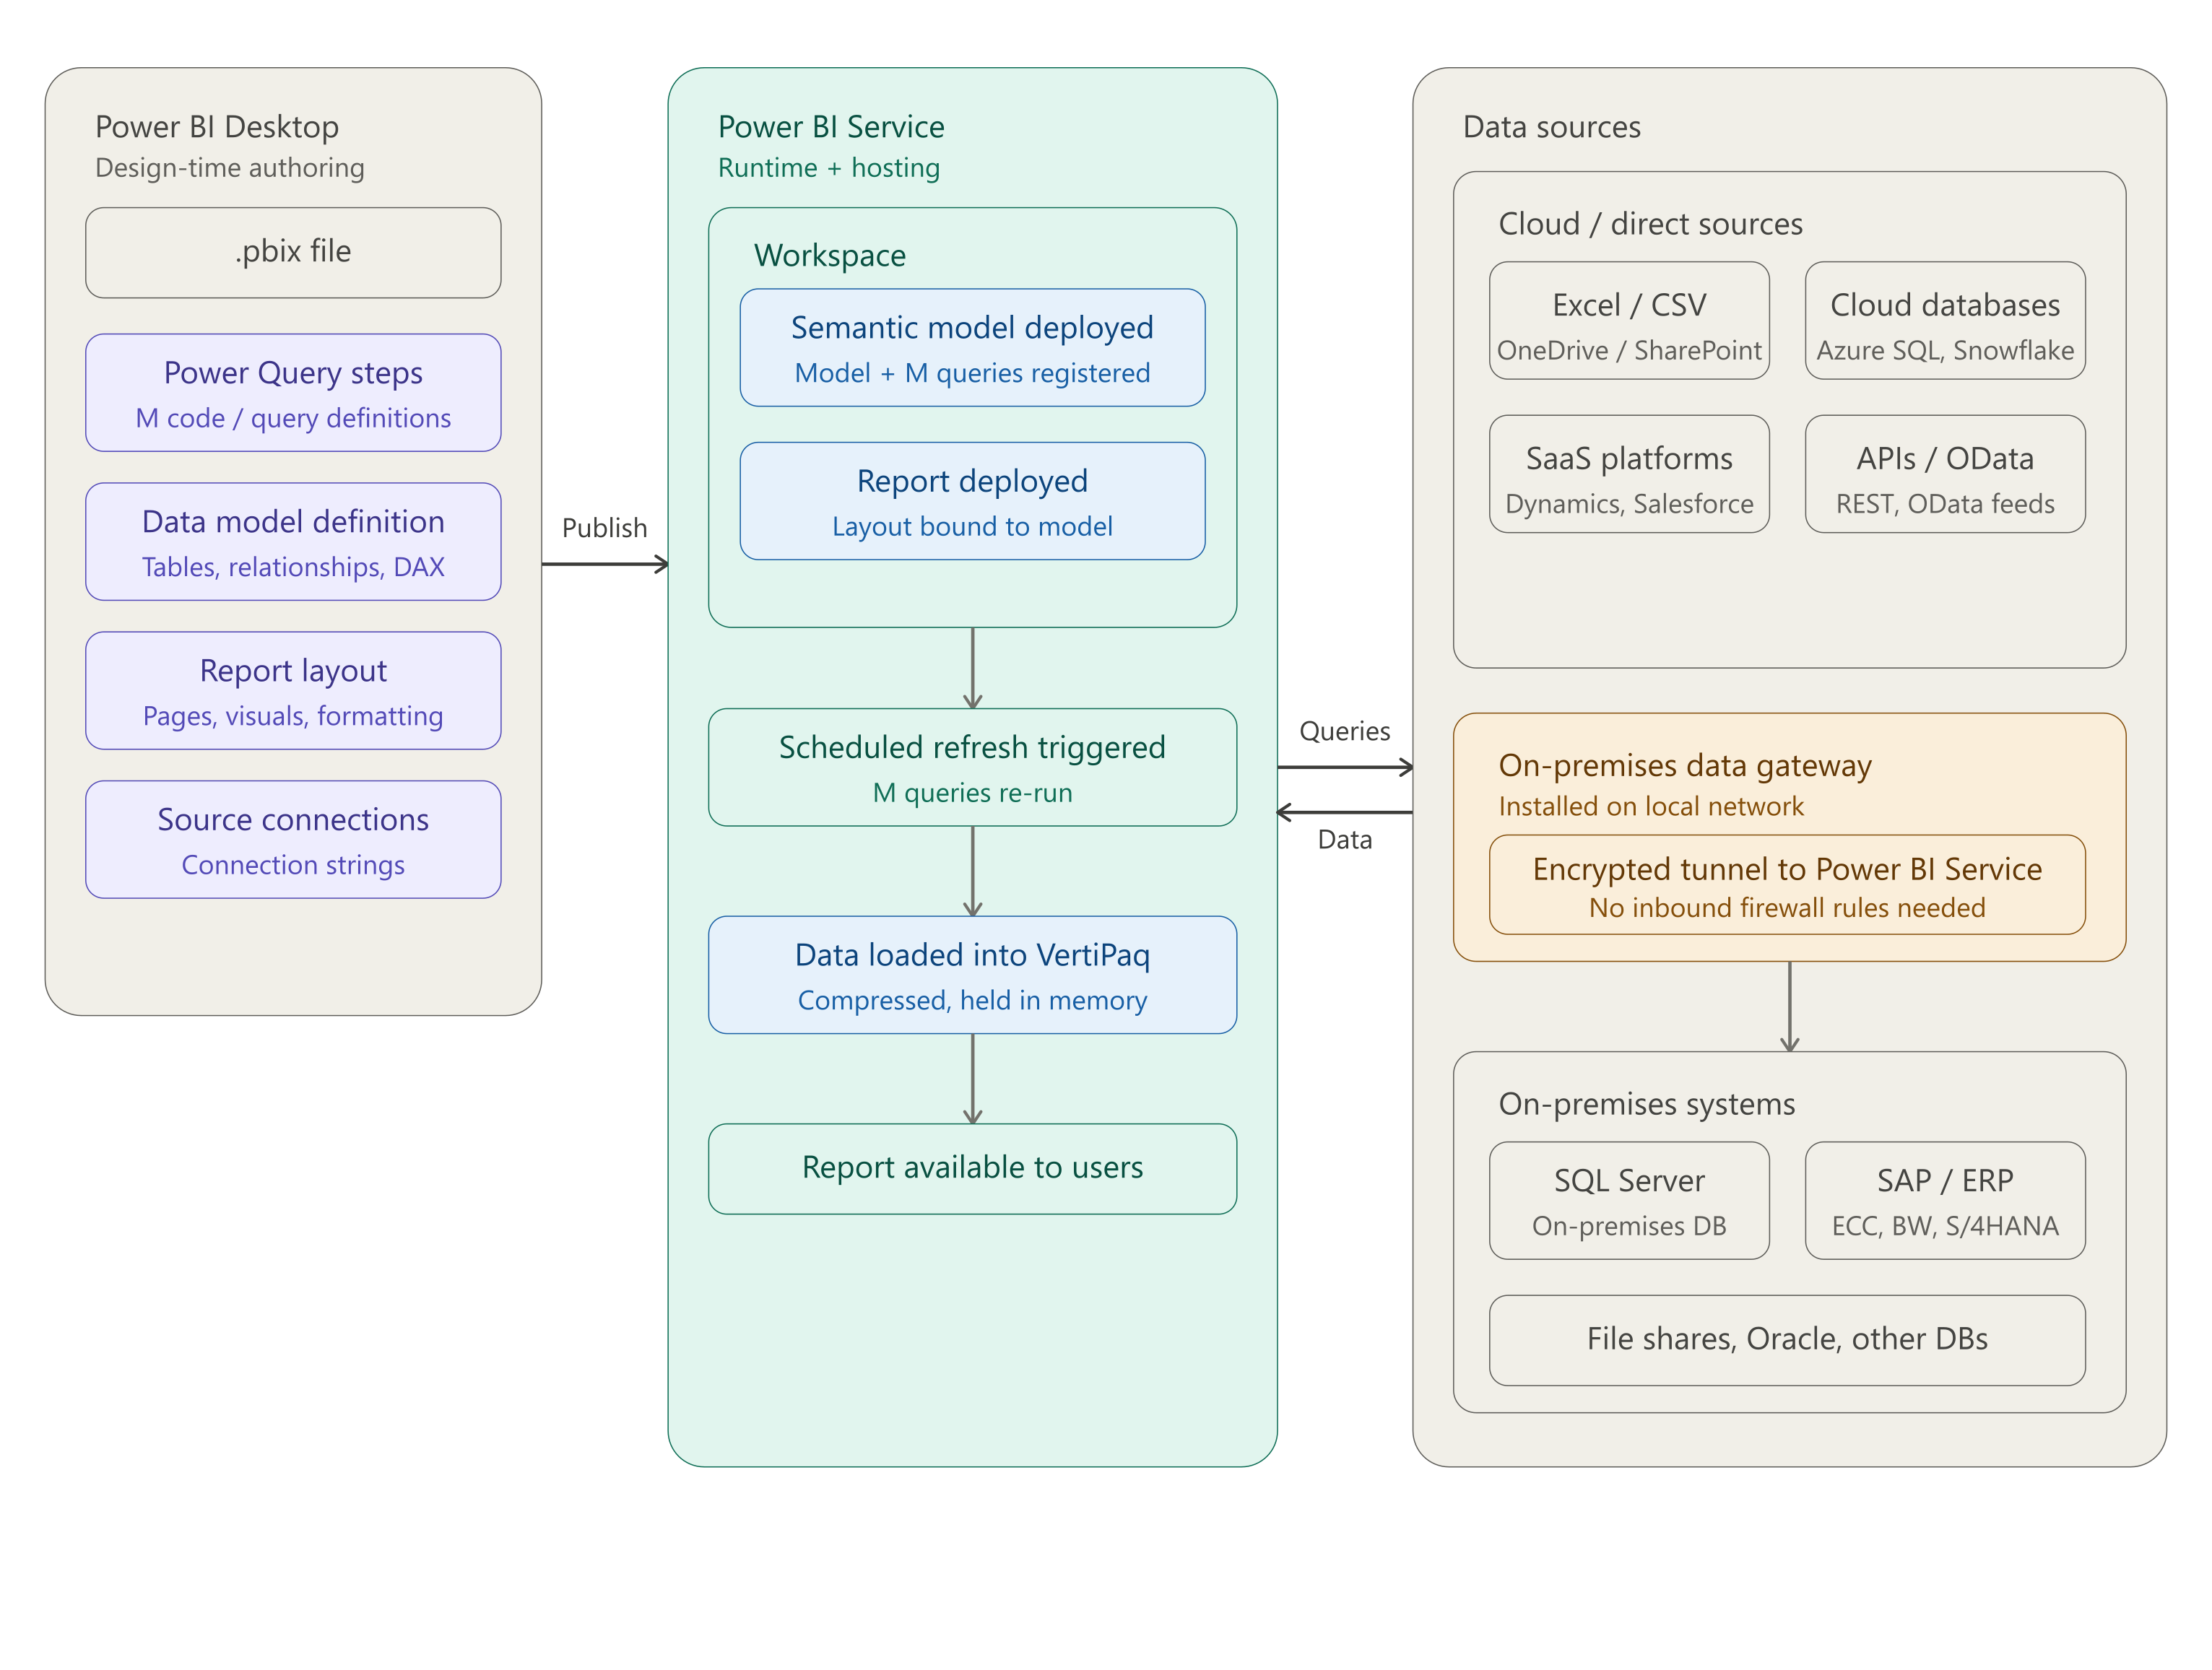
Figure 3: Understanding How the Power BI Service Works
Navigating the Power BI Licensing Maze
If there’s one part of Power BI that consistently causes confusion, it’s licensing. On the surface, the options seem straightforward, but as you start to look closer, it becomes clear that each plan is really a different way of accessing and using the underlying service in the cloud.
The challenge is that licensing decisions are not just about who can view a report. They directly impact how your data is processed, how your reports perform, and how well the platform scales as usage grows. Understanding these tradeoffs is key, especially as your Power BI environment starts to take on a more central role in the business.
Power BI Pricing Plans
At the time of this writing, Microsoft essentially offers four different Power BI pricing plans:
Free Account: This free plan is designed for trial users, students, solopreneurs, and other non-professional user types. It's essentially a free pass that gives you access to the Power BI Desktop application so you can build reports locally on your own machine. It does not include access to the Power BI Service, which means you cannot publish, share, or collaborate on reports through the web. That said, it's still surprisingly capable, as Power BI Desktop includes a lightweight version of the same in-memory VertiPaq engine used in the service, allowing you to load, model, and analyze a significant amount of data right on a laptop. For individual users exploring the tool or building personal analyses, it's more than enough to get started.
Power BI Pro ($14 per user/month): For commercial users, this is the introductory plan that report builders can use to build and publish reports using the Power BI Service — more on this in a moment. If your organization is running Microsoft 365, it's worth noting that the Power BI Pro license is bundled with the E5 licensing plan, so there's no need to purchase additional Power BI licenses for these users.
Power BI Premium Per User ($24 per user/month): In many respects, you can think of this plan as the next level up from the Power BI Pro plan. As the name suggests, it's a beefier plan that provides users with more capacity and access to premium features such as advanced dataflows and AI integration.
Power BI Embedded (variable pricing): This plan was designed to enable organizations and/or ISVs to embed Power BI analytics inside of external-facing applications. In this scenario, you're effectively paying Microsoft a premium to be able to leverage their report service infrastructure and enable non-licensed users to access the content. Although still available as a standalone license, many customers are shifting away from this plan to Microsoft Fabric plans which provide this functionality as part of Fabric.
Power BI Pro vs. Power BI Premium
At a high level, the difference between Power BI Pro and Premium comes down to how much access you have to analytics capacity in the Microsoft Power BI Service and how that capacity is allocated. With Power BI Pro, you're operating in a shared environment within the Microsoft Cloud. Your datasets, refreshes, and report queries are processed alongside those of other organizations, all drawing from the same pool of resources. This model works well for many teams, but it also means performance can vary and capacity is not guaranteed, especially as workloads grow.
Power BI Premium, on the other hand, introduces more predictable access to compute resources. Whether through Premium Per User or dedicated capacity, it reduces or eliminates contention with other tenants and provides a more consistent level of performance for larger datasets, more frequent refreshes, and higher user concurrency.
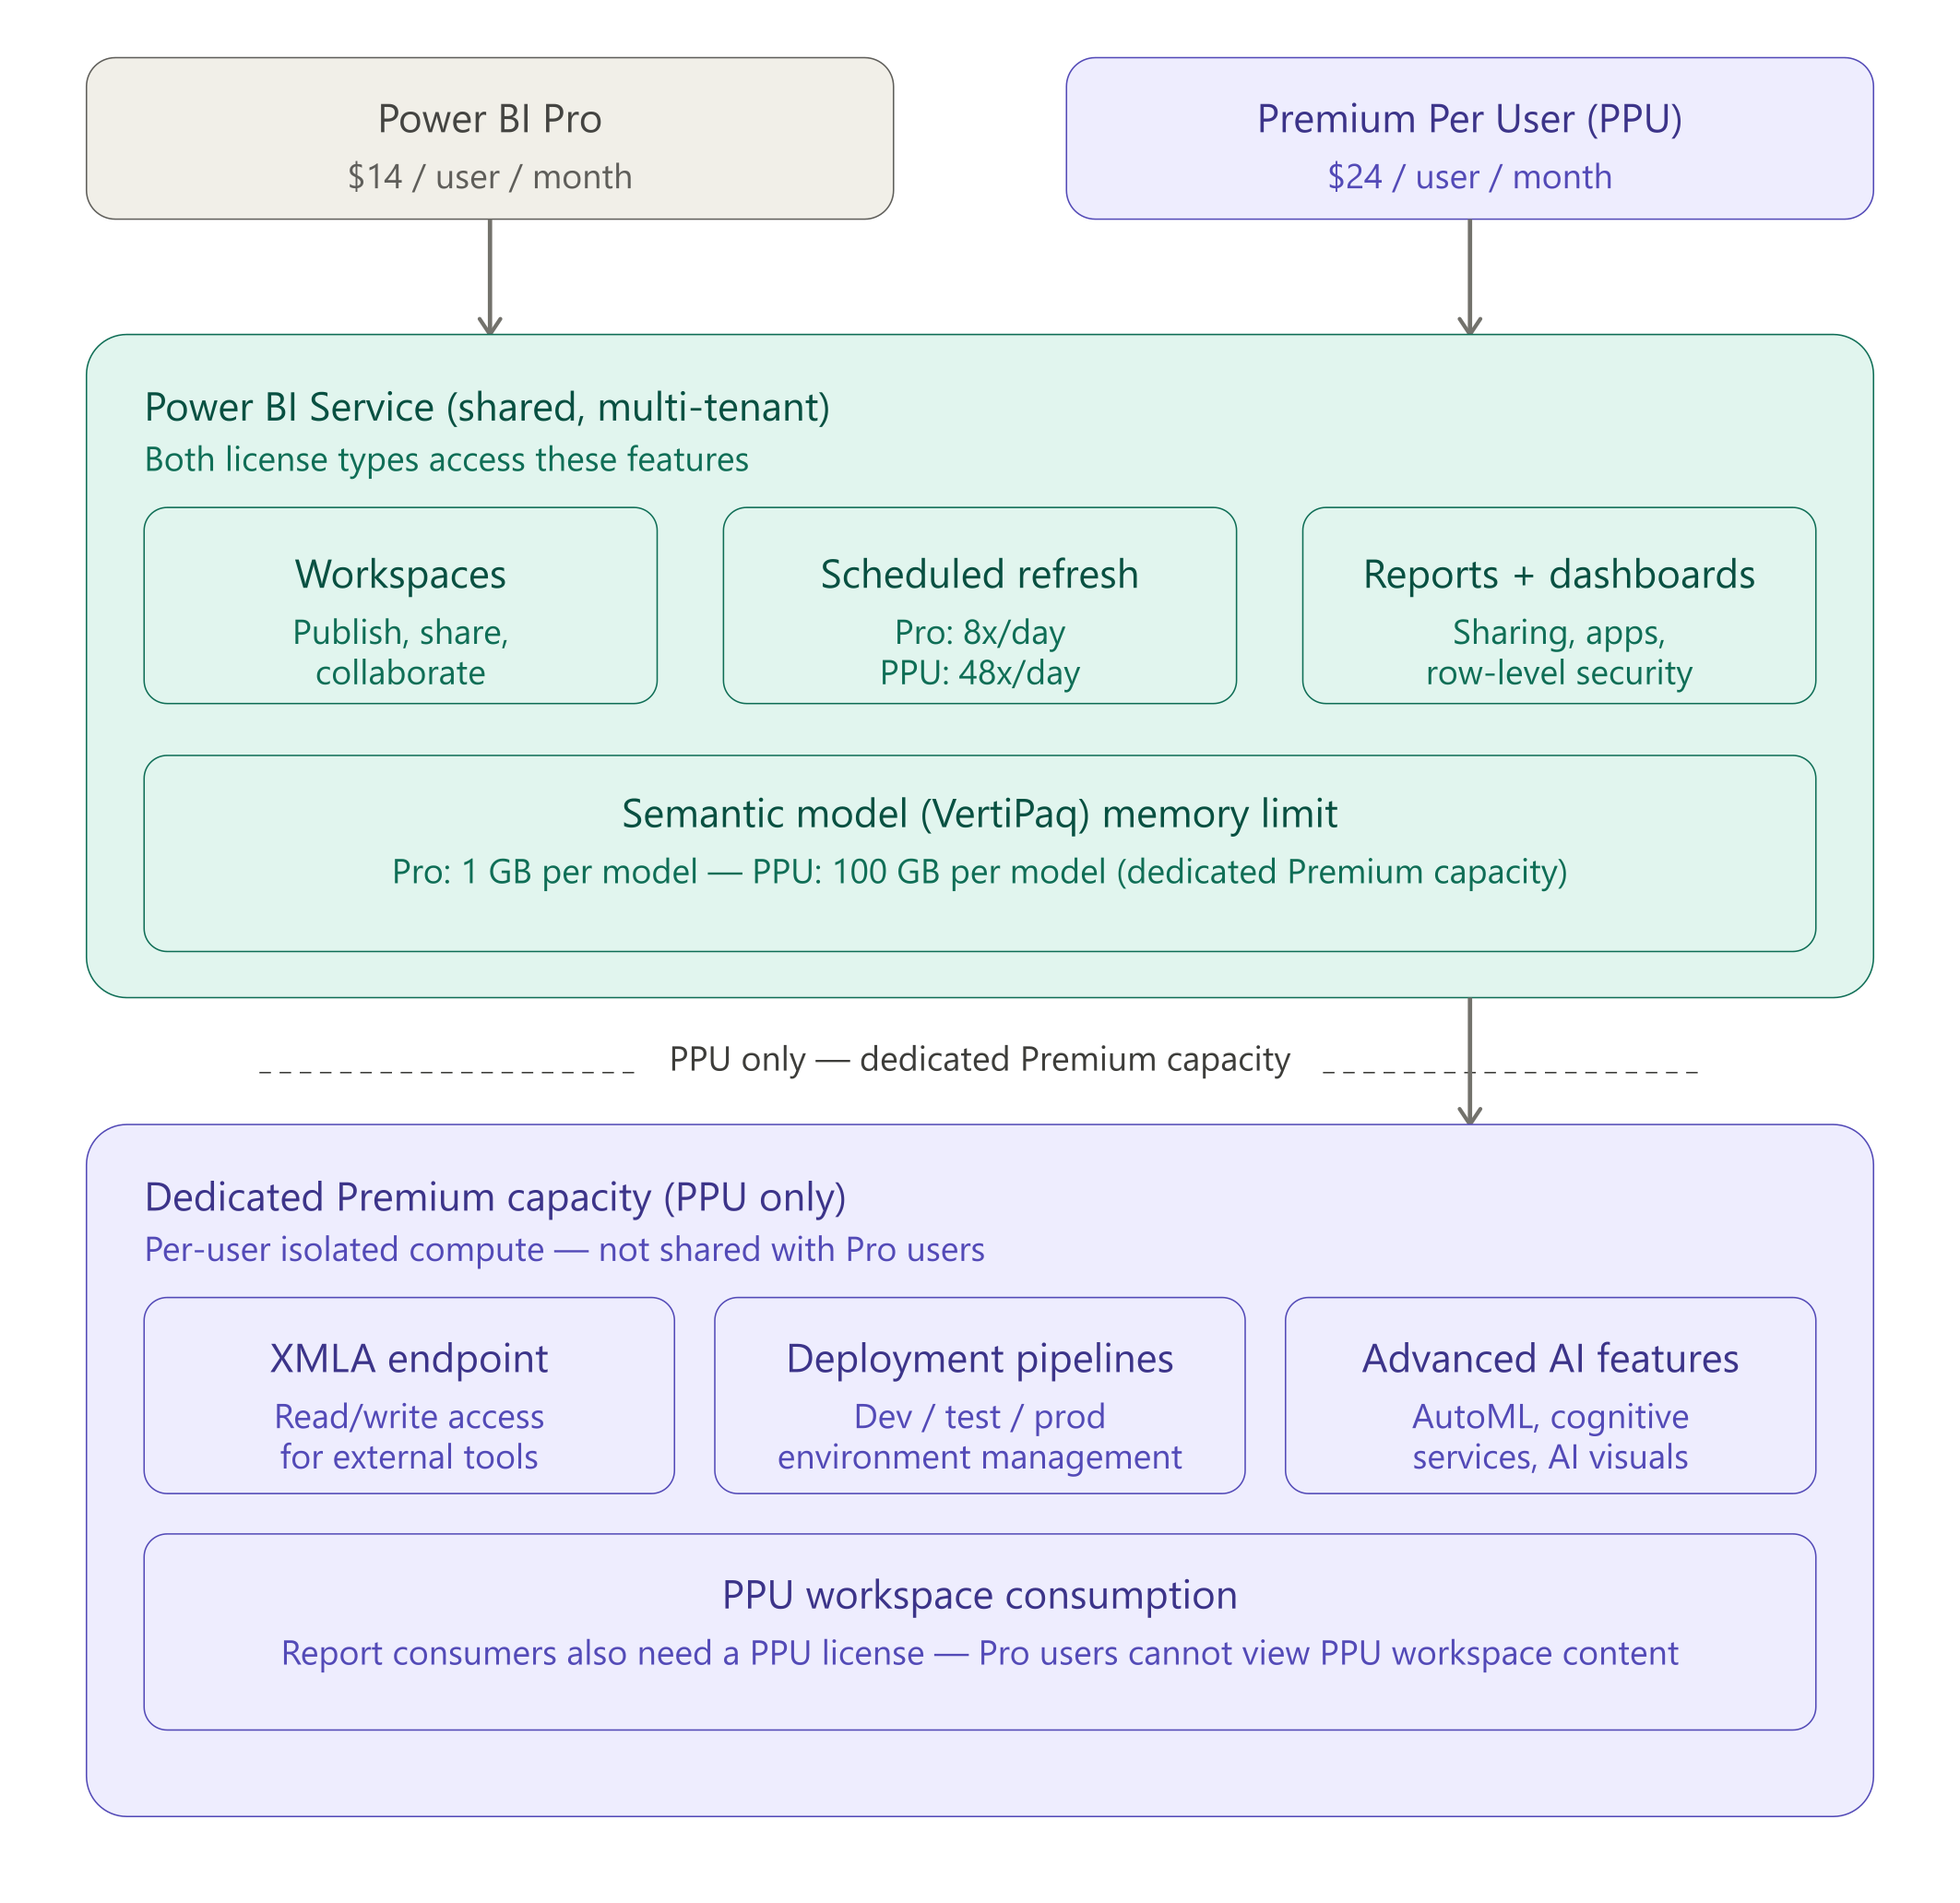
Figure 4: Resource Utilization Concepts in Power BI Pricing Plans
In practical terms, Pro is a great starting point for collaboration and lighter workloads, while Premium is designed for organizations that need scale, reliability, and greater control over how their analytics workloads are processed.
Microsoft Fabric: The Next Evolution
As we've seen, Power BI is a flexible service that makes it easy for both technical and non-technical teams to get up and running quickly building powerful BI solutions. This accessibility is a big part of its success, but as we've observed, it also means Power BI often ends up carrying more responsibility than it was originally designed for. As data volumes grow, systems become more complex, and expectations around speed and scale increase, the need for a more unified and structured approach starts to emerge.
In some cases, organizations have addressed this by pushing that complexity into 3rd-party data platforms like Snowflake or similar solutions. These platforms can provide the scale, performance, and structure needed to support more advanced analytics workloads, effectively taking pressure off Power BI. However, this approach often introduces its own challenges, including additional cost, increased architectural complexity, and the need to manage and integrate multiple systems across the data stack.
In either case, this is where Microsoft Fabric comes into the picture. Rather than replacing Power BI, Fabric builds on top of it by bringing enterprise-grade data integration, storage, engineering, and analytics into a single platform. The goal is not to change how teams use Power BI, but to give it a stronger foundation so it can scale with the business. In many ways, Fabric represents the natural next step for organizations that have outgrown the “accidental data platform” phase and are ready to take a more intentional approach to managing and using their data.
What is Fabric?
At its core, Fabric is Microsoft’s attempt to bring the entire data and analytics lifecycle into a single, unified platform. Instead of stitching together separate tools for data integration, storage, engineering, analytics, and reporting, Fabric brings all of those capabilities together in one place, built around a shared foundation (see Figure 5).
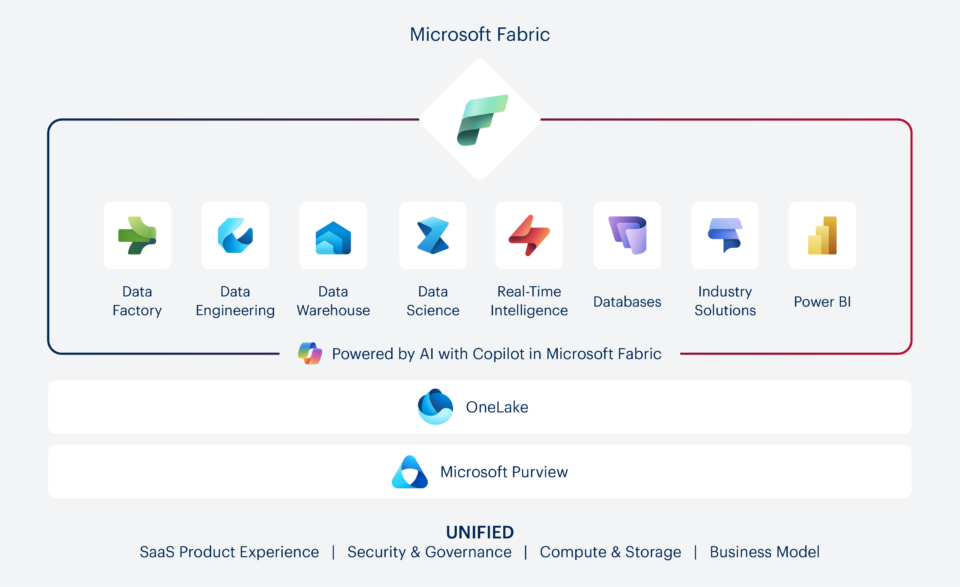
Figure 5: Microsoft Fabric Platform Overview
This foundation is what sets Fabric apart. Rather than moving data between systems, Fabric is designed around the idea of a single, centralized data layer where everything lives and can be accessed by different workloads. Whether you're ingesting data, transforming it, modeling it, or visualizing it, you're working against the same underlying data without constantly copying or duplicating it across environments.
Another important aspect of Fabric is that it's delivered as a SaaS offering. As a result, there's no infrastructure to stand up or manage. Capacity, performance, and scaling are handled within the platform, allowing teams to focus more on delivering insights and less on maintaining the underlying systems. This also makes it easier to get started incrementally, whether that means modernizing a single pipeline, consolidating data sources, or building out a more formal data platform over time.
Where Does Power BI Fit into All This?
If you're already running Power BI workloads, it's worth noting that the platform powering those workloads is already Microsoft Fabric. The only difference is that you're using a slimmed down version that's included with your existing Power BI license plan.
In this sense, Power BI isn't being migrated to Fabric; Fabric was designed from the ground up to facilitate a seamless transition from day one. As you can see in Figure 5, Power BI is a core workload within the Fabric architecture, not an add-on or an afterthought.
For end users, that means the transition is more of a reframing than a disruption. The report-building experience stays the same, the development concepts are familiar, and existing investments in dashboards and semantic models carry forward intact. What's changed isn't what you see, it's what's running underneath.
Before Fabric, Power BI operated on its own service layer. Licensing plans like Pro and Premium determined how much shared or dedicated cloud capacity you had access to, and the platform largely stood on its own. Fabric changes that equation. Rather than a standalone analytics service, Power BI now runs as part of a unified environment where data ingestion, transformation, storage, and reporting all share the same underlying compute and storage layer.
The practical implication is significant: your reports and models don't just work in isolation anymore. They sit inside a platform where the data pipeline feeding them, the data storage area, and the capacity powering the queries are all part of the same fabric (pun intended).
Building the Business Case for Fabric
Now that we've established how Power BI and Fabric relate to each other, the real question is whether Fabric is worth the additional investment for your organization. It's a fair question — Fabric capacity starts at a few hundred dollars a month and can run to $5,000 or more for larger organizations. That's not a trivial budget line item, and it deserves an honest answer.
But before evaluating what Fabric costs, it's worth asking what the current approach is already costing you.
The Hidden Cost of Working Around Your Data
Most organizations that rely primarily on Power BI for their data needs have developed workarounds they've stopped noticing. Data gets pulled from source systems into Excel, cleaned up manually, uploaded into Power BI, shaped into a report, and shared with a handful of people who need it. A week later, someone else needs something similar, and the whole process starts again from scratch. Meanwhile, the same data is living in five different places, owned by nobody, and slowly drifting out of sync.
This isn't a failure of effort. It's a failure of infrastructure. Without a centralized place to bring data together, transform it reliably, and make it available for reuse, every team ends up solving the same problems independently. The result is a growing collection of one-off solutions that are expensive to maintain, difficult to trust, and nearly impossible to scale.
The hours spent on this work are real. If a data analyst or a business user is spending even half a day each week exporting, cleaning, uploading, and rebuilding reports that could be automated or centralized, that's time that isn't going toward the analysis that actually drives decisions. Multiply that across a team and the cost of the status quo starts to look a lot less comfortable than a Fabric capacity bill.
Getting More Out of Your Analytics Investments
Without access to a centralized data platform, many organizations find themselves accumulating technical debt by repeatedly creating throw-away data models in Power BI. These models are purpose built for specific reports but are difficult to reuse elsewhere. Data gets copied and reshaped multiple times across different tools and teams.
While these efforts often get dismissed as low-level data wrangling, the truth is that there's value in this work. Whether they realize it or not, business teams are downloading valuable institutional knowledge into these models, translating raw data into insights that can be used for way more than just reporting.
To put these concepts into perspective, consider the flow diagram shown in Figure 6 below. Here, we can see how a semantic model used in a Power BI report can be reused in Fabric Data Science to conduct data science experiments and develop AI models. These days, we can also utilize these models to develop agentic AI solutions using Fabric data agents.
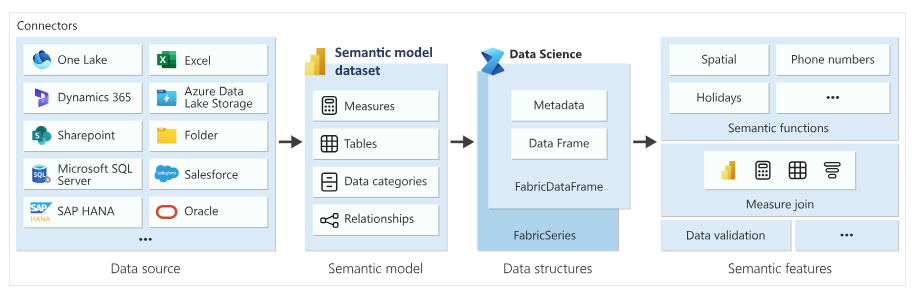
Figure 6: Reusing Semantic Models in Fabric Data Science
Broadening Your Data Horizons
Chances are your business has data gaps you've stopped noticing. Your CRM knows which deals are stalling. Your support platform knows which customers are at risk. Your marketing tools know which campaigns are actually converting. But if that data never connects to the rest of your reporting environment, it creates blind spots that are easy to miss precisely because you can't see what you're missing.
This is the problem Fabric Data Factory is built to solve. It brings the same industrial-strength data integration capabilities that enterprise teams have relied on in Azure Data Factory into the Fabric environment, but with the same low-code, self-service approach that made Power BI accessible to your team in the first place.
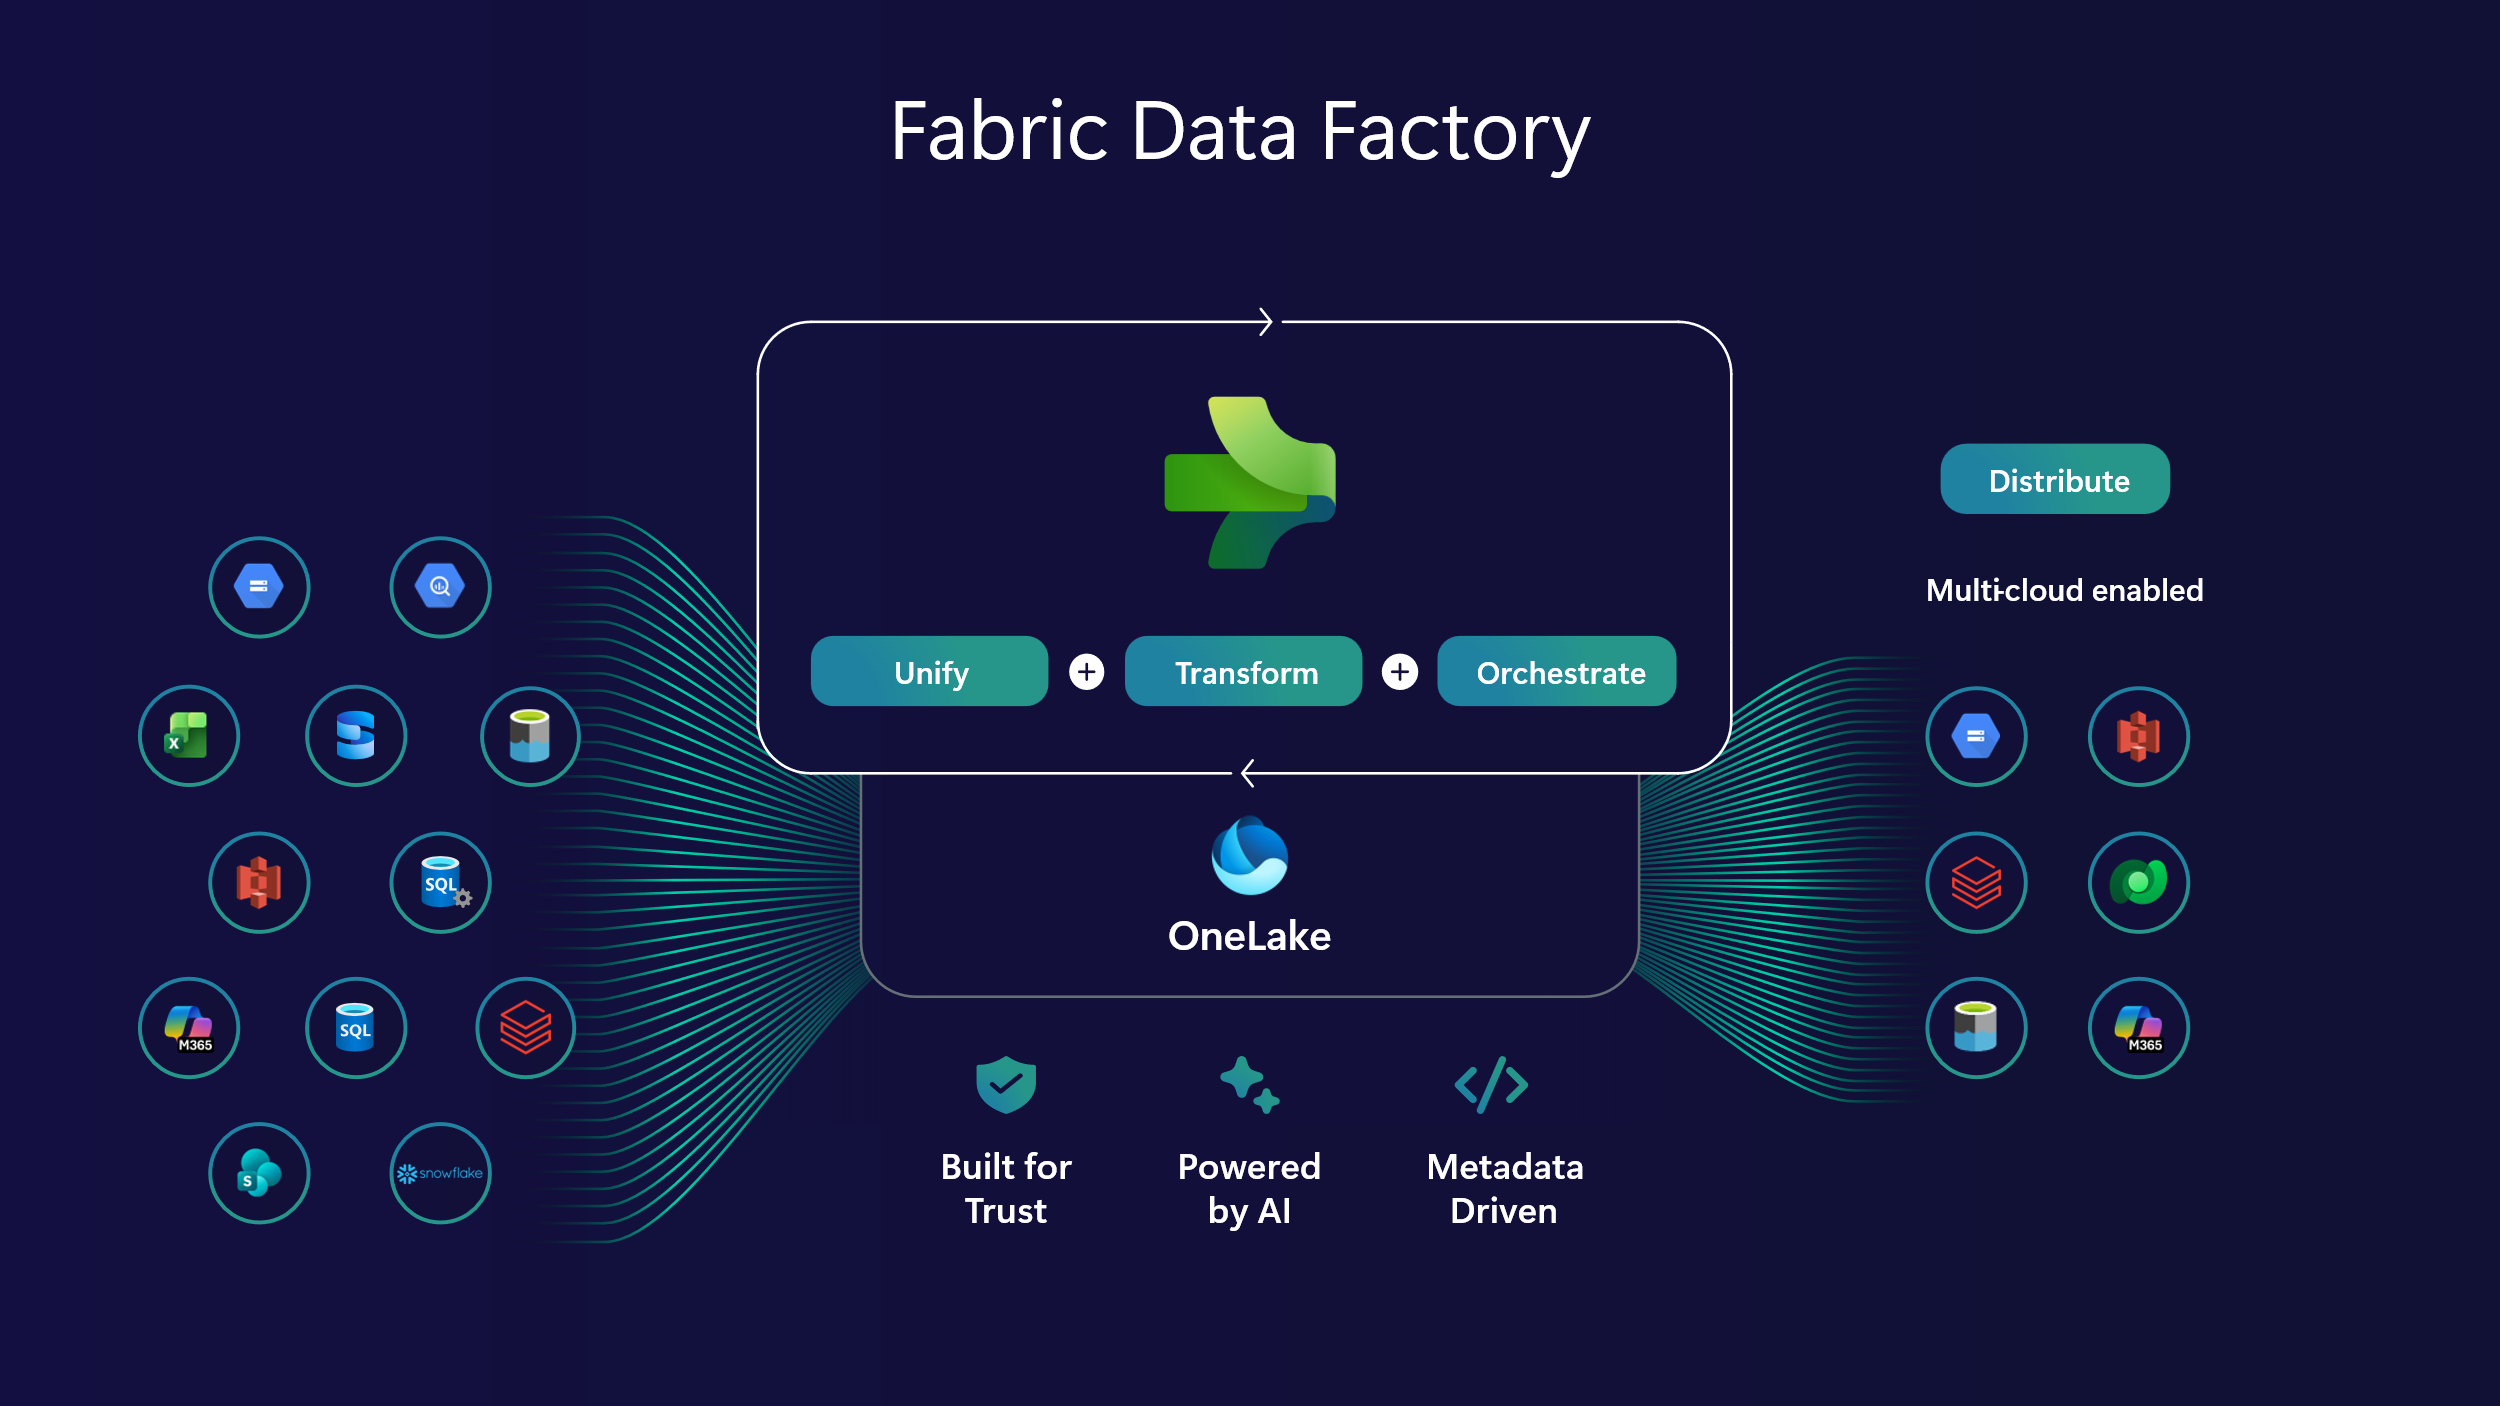
Figure 7: Breaking Down Data Silos with Fabric Data Factory
In practical terms, you can build reliable, automated pipelines that pull data from the SaaS platforms your business runs on: Salesforce, Dynamics 365, HubSpot, ServiceNow, and hundreds of others. That data flows into a centralized environment where it can be combined, modeled, and reported on alongside everything else. The data that was previously siloed inside individual tools becomes part of a coherent picture. Your blind spots start to close.
What makes this particularly valuable if you don't have a dedicated data engineering team is that these pipelines don't require one. Where building and maintaining data integrations once meant custom code, ongoing maintenance, and specialist knowledge, Fabric Data Factory puts that capability within reach of your analysts and technically minded business users. The barriers that previously kept certain data sources out of your reporting environment are largely gone.
Performance & Scalability
Performance and scalability are also key considerations. Fabric is designed to grow with your business, handling increasing data volumes and more demanding workloads without requiring a complete re-architecture. Capabilities like Direct Lake mode push Power BI analytics closer to real-time access (see Figure 8 below), allowing users to work with fresh data without the delays typically associated with traditional refresh cycles.
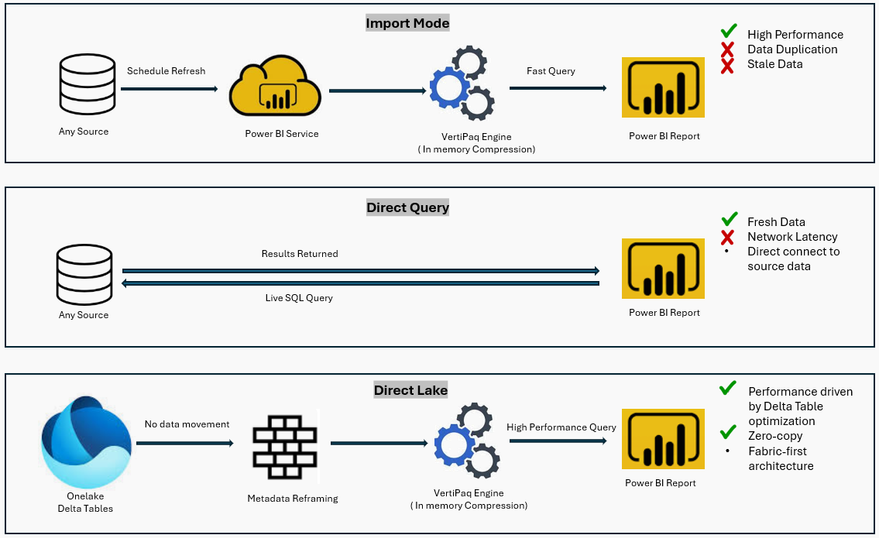
Figure 8: Understanding Direct Lake Mode in Fabric
From Intelligence to Action
Beyond reporting, Fabric also opens the door to new types of workloads. Real-Time Intelligence enables organizations to react to events as they happen, while built-in data science capabilities allow teams to move from descriptive analytics into predictive and prescriptive use cases. With Fabric IQ, existing semantic models can be reused to power AI-driven experiences, including data agents that can interact with business data in more natural ways.

Figure 9: Reacting to Events in Real Time with Fabric Real-Time Intelligence
What Fabric Actually Changes
As we've seen, Fabric doesn't just add more features on top of Power BI. Instead, it replaces the workaround culture that often exists in standalone Power BI environments with a proper foundation.
OneLake gives your organization a single logical place to store and manage data, which means teams stop duplicating datasets and start building on top of each other's work instead of around it. Data Factory brings industrial-strength pipeline capabilities into the same environment, so the manual steps that currently live in Excel macros or someone's desktop can be automated and made reliable. And because everything runs on shared capacity, the incremental cost of adding a new workload is a fraction of what it would cost to stand up a separate tool.
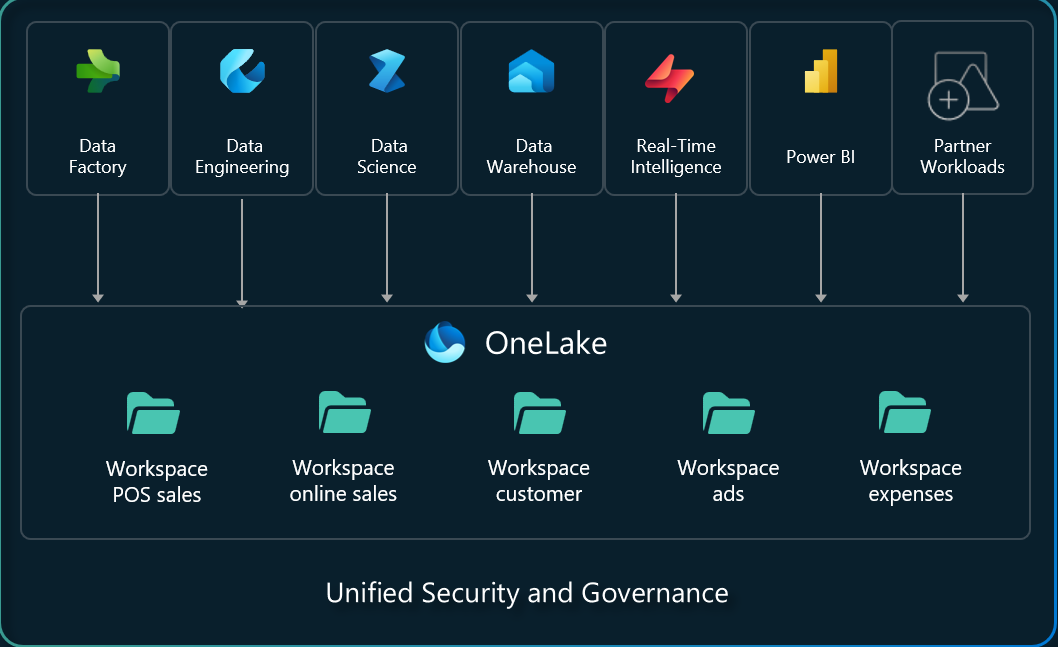
Figure 10: Bringing All Your Data Under One Roof with OneLake
The capabilities that were previously out of reach without a dedicated data engineering team — real-time data processing, predictive analytics, reusable enterprise-grade data models — become accessible within the same platform your Power BI users are already working in. Fabric's Direct Lake mode alone can meaningfully change how fresh your data is when it reaches a report, eliminating the lag that scheduled refresh cycles introduce.
Is Fabric Right for My Organization?
As we've seen, Fabric is not a one-size-fits-all solution. It's a flexible platform designed to grow with your business — but it is a separate expense with its own licensing model, and that investment needs to make sense for where you are right now.
If you're a smaller organization with relatively simple data needs, stable workloads, and a primary focus on reporting, Fabric may be more platform than you need today. You can continue running Power BI on its own using Power BI Pro or Premium Per User licenses, and that combination will serve you well for the foreseeable future.
The case for Fabric becomes more compelling as complexity increases. When data volumes grow, when more teams need access to more sources, and when the limitations of a reporting-first setup start creating real friction — that's when the investment starts to pay for itself. Some telltale signs you've reached that point:
Your scheduled data refreshes aren't keeping up with how fast the business moves.
Your analysts are spending more time wrangling data than interpreting it.
When leadership starts asking questions that the current setup can't answer without a week of manual work.
The same data is being rebuilt in multiple reports by multiple people, with no single source of truth.
You're hitting the edges of what Power BI can do on its own — model size limits, refresh frequency caps, or the need for more advanced capabilities like real-time data, predictive analytics, or enterprise-grade pipelines.
If you're wrestling with any of these types of issues, it's worth having a more detailed conversation about whether Fabric is the right next step. The good news is that you don't have to figure it out alone. Our team works with organizations at every stage of this journey, from those just getting started with Power BI to those ready to build out a full data platform on Fabric. Wherever you are, we can help you make the right call.
Closing Thoughts
No matter how you arrived at where you are today, the question worth asking isn't how you got here. It's whether your current setup can take you where you need to go next. For many organizations, that's the moment the Fabric conversation starts to make sense.
For some teams, Power BI will continue to be the right answer for quite a while. For others, particularly those dealing with larger data volumes, more complex source systems, and growing expectations from the business, Fabric offers a natural next step. It doesn't ask you to start over. It gives structure and scale to what you've already built, reducing duplication, improving performance, and opening the door to capabilities that simply aren't possible in a reporting-only environment.
Ultimately, this isn't about chasing the latest platform. It's about making sure your data strategy can keep pace with your business. Whether that means staying the course with Power BI for now or taking the next step toward Fabric, the goal is the same: data your organization can trust, scale, and act on.