
Whenever we talk to customers about data strategy, we often find that they have a tendency to equate “doing something with data” with building more reports or dashboards. While reporting's definitely important, it leaves a lot of meat on the bone in terms of what we can accomplish these days with data. In the age of AI, the name of the game is to use information to drive action, automate decisions, and anticipate what’s next.
If you're like most organizations, you're probably sitting on a wealth of data that could unlock transformational value. The problem is that, like oil, mining data for insights can be difficult. And, without the right tools to refine it, it never reaches its full potential. The good news is that modern data platforms like Microsoft Fabric are making it easier than ever to connect information across systems, automate the heavy lifting, and turn raw data into real-time intelligence that drives action.
With those concepts in mind, this post explores ten practical ways that we can turn everyday business data into uncommon value. From blending insights across your SaaS apps and ERP systems to applying AI and real-time analytics, we’ll look at how modern tools can help you move beyond reporting and start creating some real business impact.
1) Combining SaaS Data for a 360° View of Your Business
If your organization is like most, SaaS sprawl has likely become a very real challenge. Over time, every team finds its own favorite tools: line-of-business (LOB) apps, Microsoft 365 apps like SharePoint and OneDrive, and, as you can see in Figure 1 below, an ever-growing list of line-of-business apps that promise to make life easier. The problem is, each of those systems ends up speaking its own language, making it all the more difficult to connect the dots in process flows, etc.
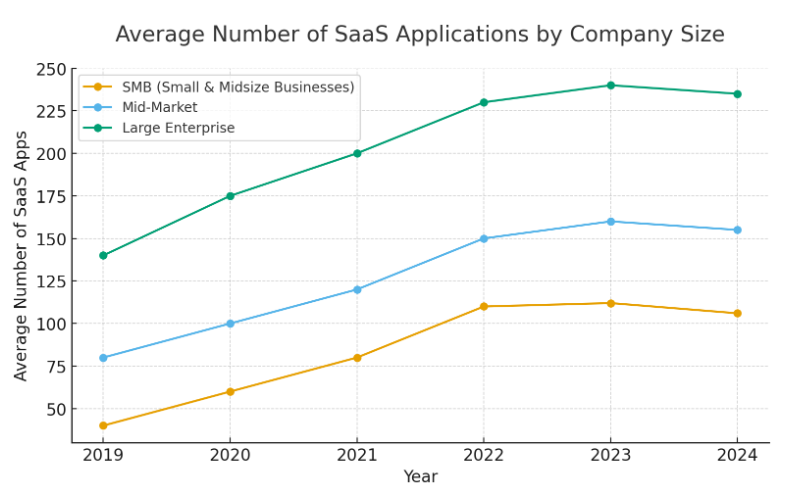
Figure 1: Average Number of SaaS Applications Used in Organizations
Before long, you’ve got data living in silos, business processes that are tedious and disjointed, and people re-keying the same information in multiple systems. It slows everyone down and makes it hard to see the big picture. At the end of the day, you might be accumulating some really great data, but it’s scattered in too many places to be useful when you need it most.
Fortunately, modern low-code data integration tools are making it easier than ever to bring all these data sources together underneath one roof. By connecting your SaaS apps and creating a single view of your data, you can finally get that 360° perspective of how your business actually runs. The result is a unified, data-driven foundation that replaces reporting silos with a single source of truth for faster, more informed decision-making.
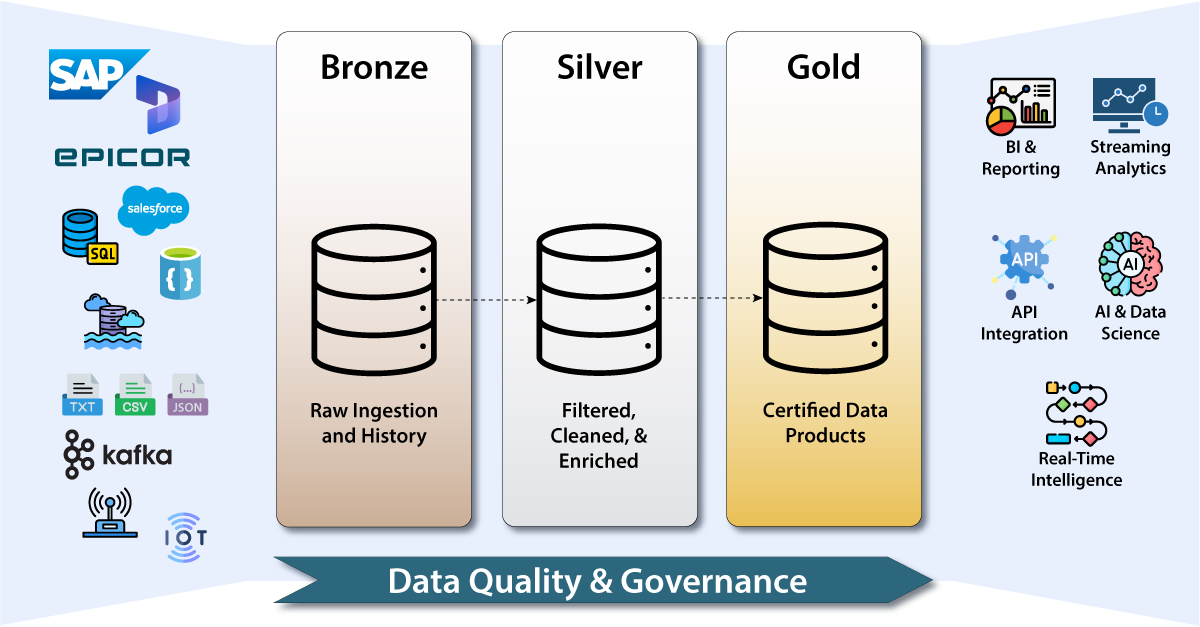
Figure 2: Bringing Data Together Underneath One Roof
To put these benefits into perspective, consider the regional sales forecast shown in Figure 3 below. In this example, data from both HubSpot and Shopify is being brought together to create a comprehensive view of sales by region. Before, compiling a view like this would require that users jump back and forth between both systems — HubSpot for deal forecasts and Shopify for actual sales performance — and then export everything into Excel. From there, they’d build pivot tables and manually stitch the data together just to produce a single, consolidated report for management.
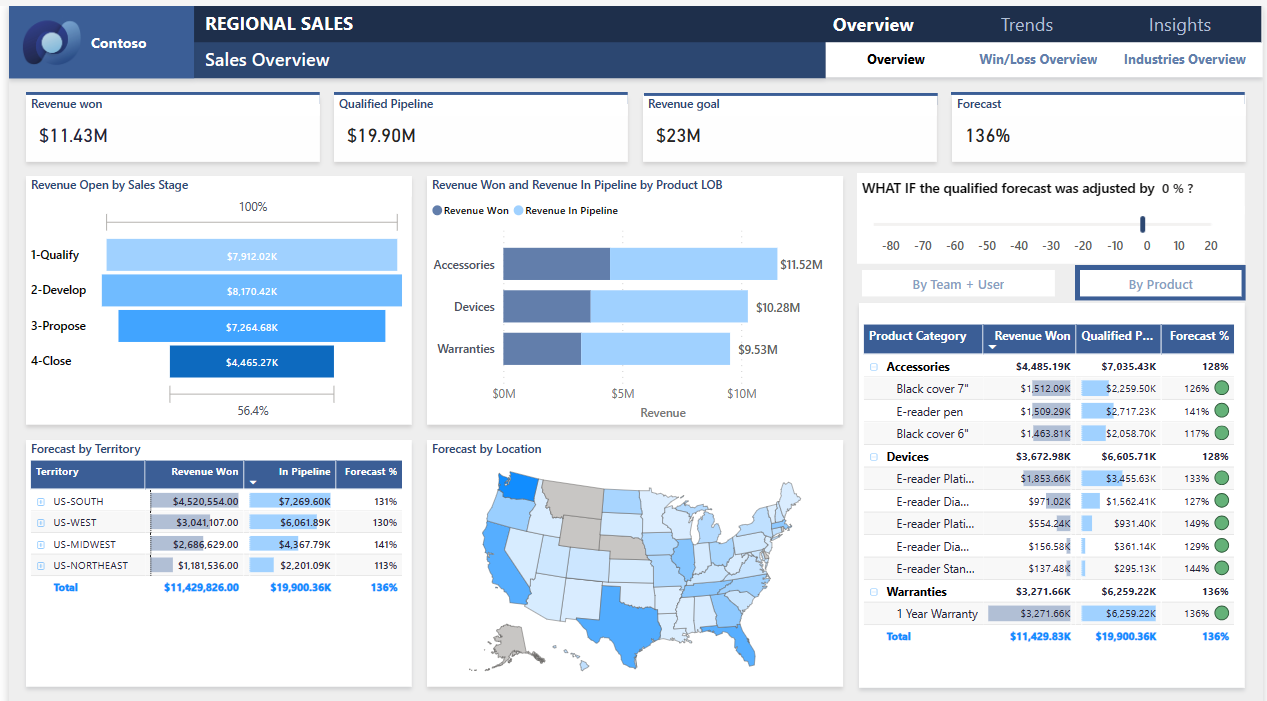
Figure 3: Consolidated Sales Forecast Dashboard
By making a one-time, up-front investment to consolidate this data, we can not only unlock the creation of impactful dashboards, but eliminate all the manual steps that used to slow teams down. No more exporting spreadsheets, building pivot tables, or stitching reports together every month. Instead, everything flows into one connected model that updates automatically, making real-time dashboards like the one in Figure 3 simple to build, easy to maintain, and always ready to support faster, more confident decisions.
2) Unlocking Self-Service Analytics
Once data is consolidated, both IT and business teams can finally play to their respective strengths. IT teams can take the lead by using tools like Fabric Data Factory to integrate data from disparate systems and shape it into reliable, secure, business-friendly models. This creates a solid foundation that the entire organization can trust.
From there, business teams can step in with user-friendly tools like Power BI (see Figure 4 below) to explore, visualize, and analyze the data through the lens of their day-to-day experience. They know the processes, the pain points, and the questions that matter most and now they have the freedom to get answers without waiting in line for IT.
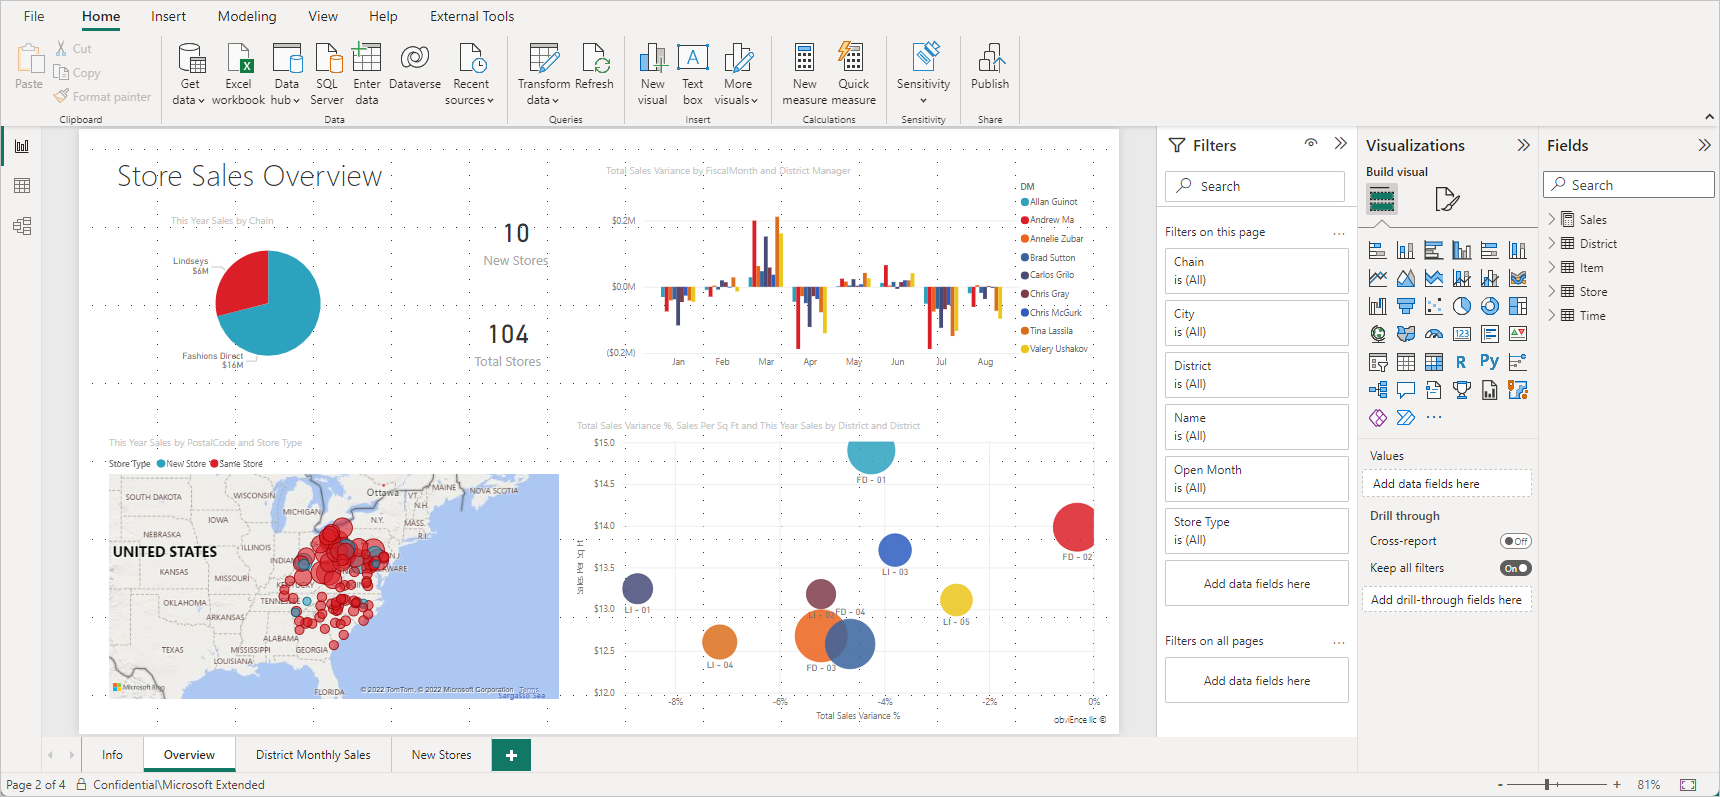
Figure 4: Working with Power BI Desktop
As you can see in Figure 5, self-service visualization strikes an ideal balance with business intelligence (BI): IT controls the quality and governance, while business teams gain the autonomy to uncover insights and make faster, smarter decisions. This is how modern organizations turn data consolidation into true self-service analytics and set their teams up for long-term success.
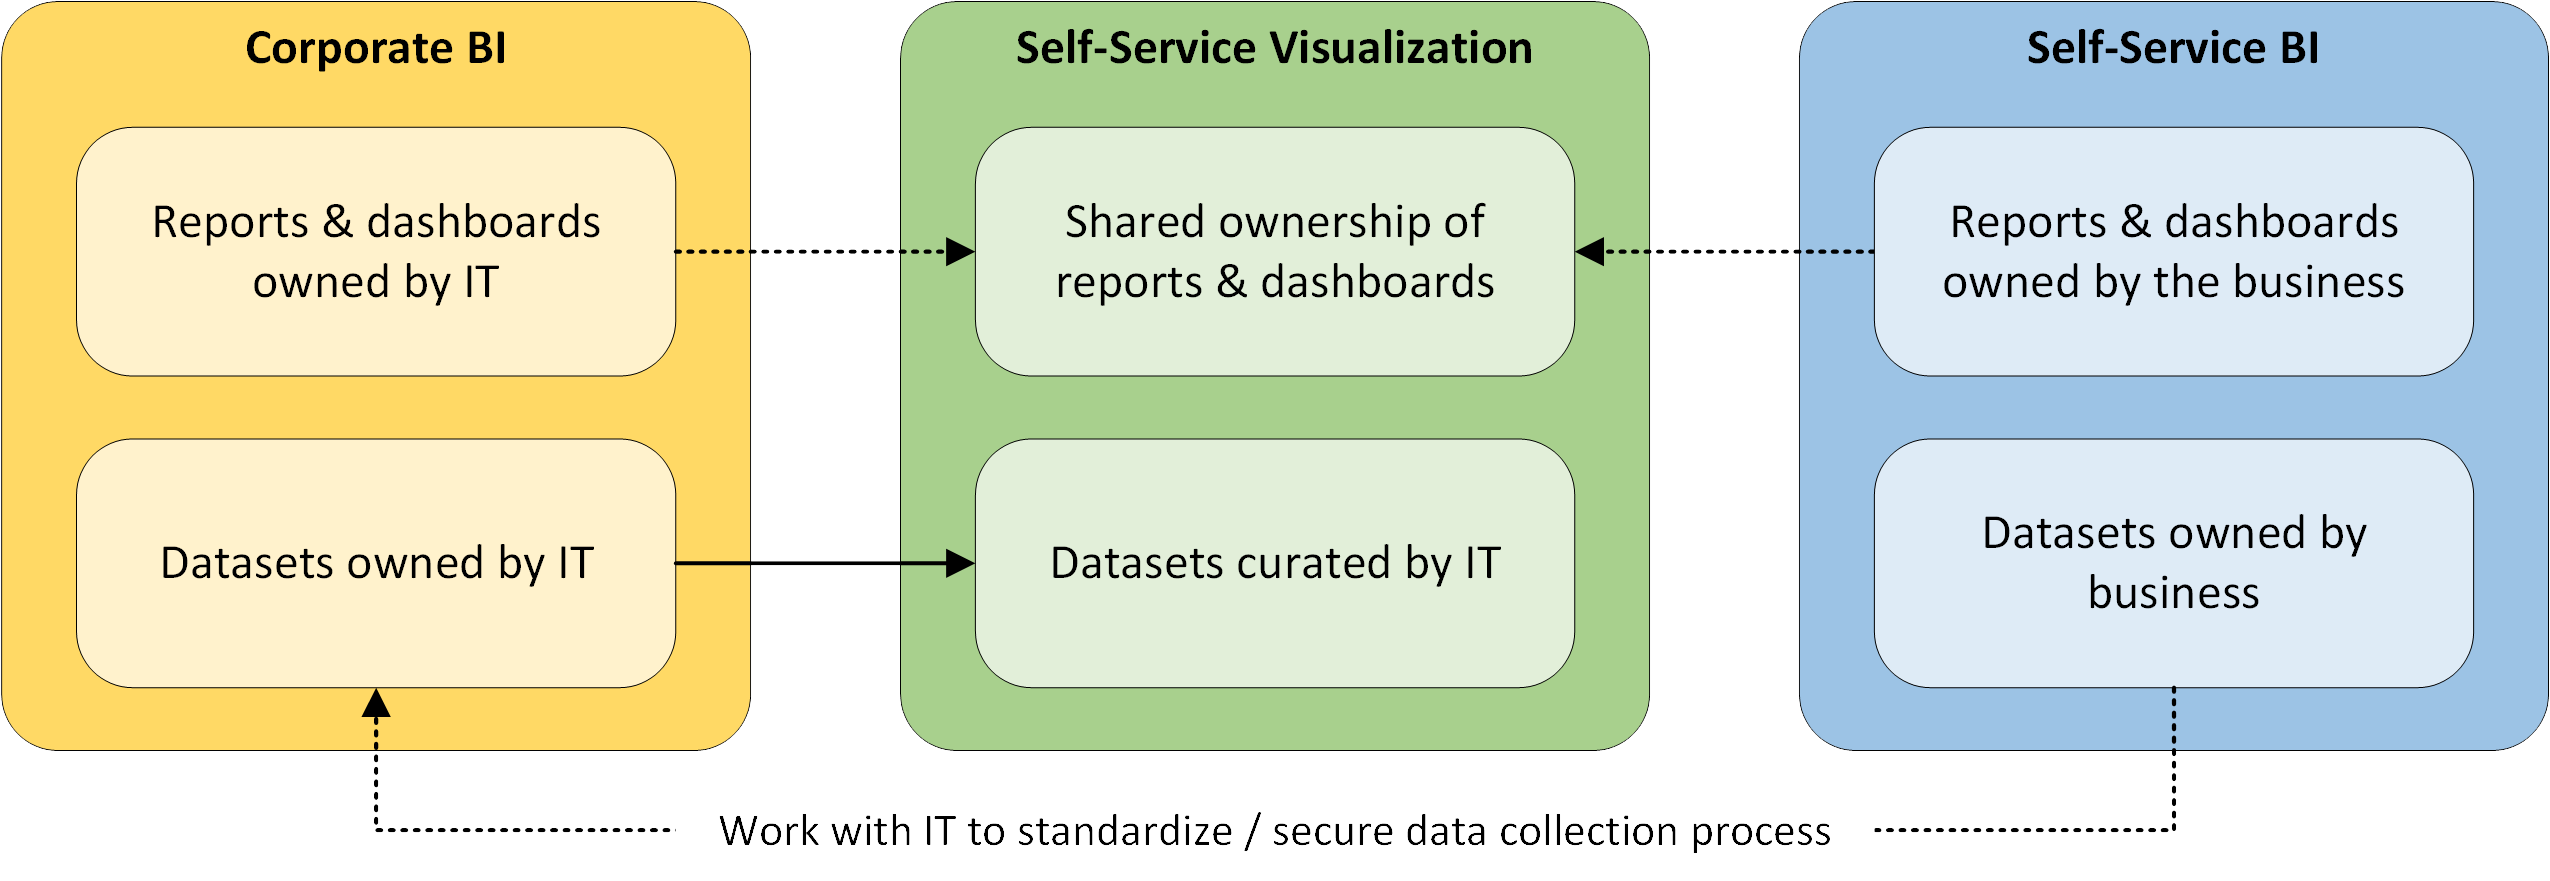
Figure 5: Striking an Ideal Balance with Business Intelligence Solutions
3) Reducing Support Overload with Data-Powered Portals
With data consolidation, we’re not just giving internal teams a clearer, real-time view of where things stand. We’re also creating new opportunities to share timely, accurate information with your customers, partners, and suppliers. With the right portal experience, everyone gets the visibility they need without waiting on a phone call or an email response.
One of the easiest ways to improve service quality — while also taking pressure off your support teams — is to put key information directly into the hands of customers and other business partners. With Microsoft Fabric, it’s simple to securely embed Power BI reports and dashboards into self-service portal experiences, giving consumers instant access to the insights they need.
To put this concept into perspective, consider the customer self-service portal shown for a fictitious parts manufacturer in Figure 6 below. Instead of calling in to check order status, review account details, track service requests, or validate billing information, customers can log in and get answers on their own. This not only creates a smoother, more transparent experience for them, but also dramatically reduces the volume of routine inquiries that tie up your support team’s time.
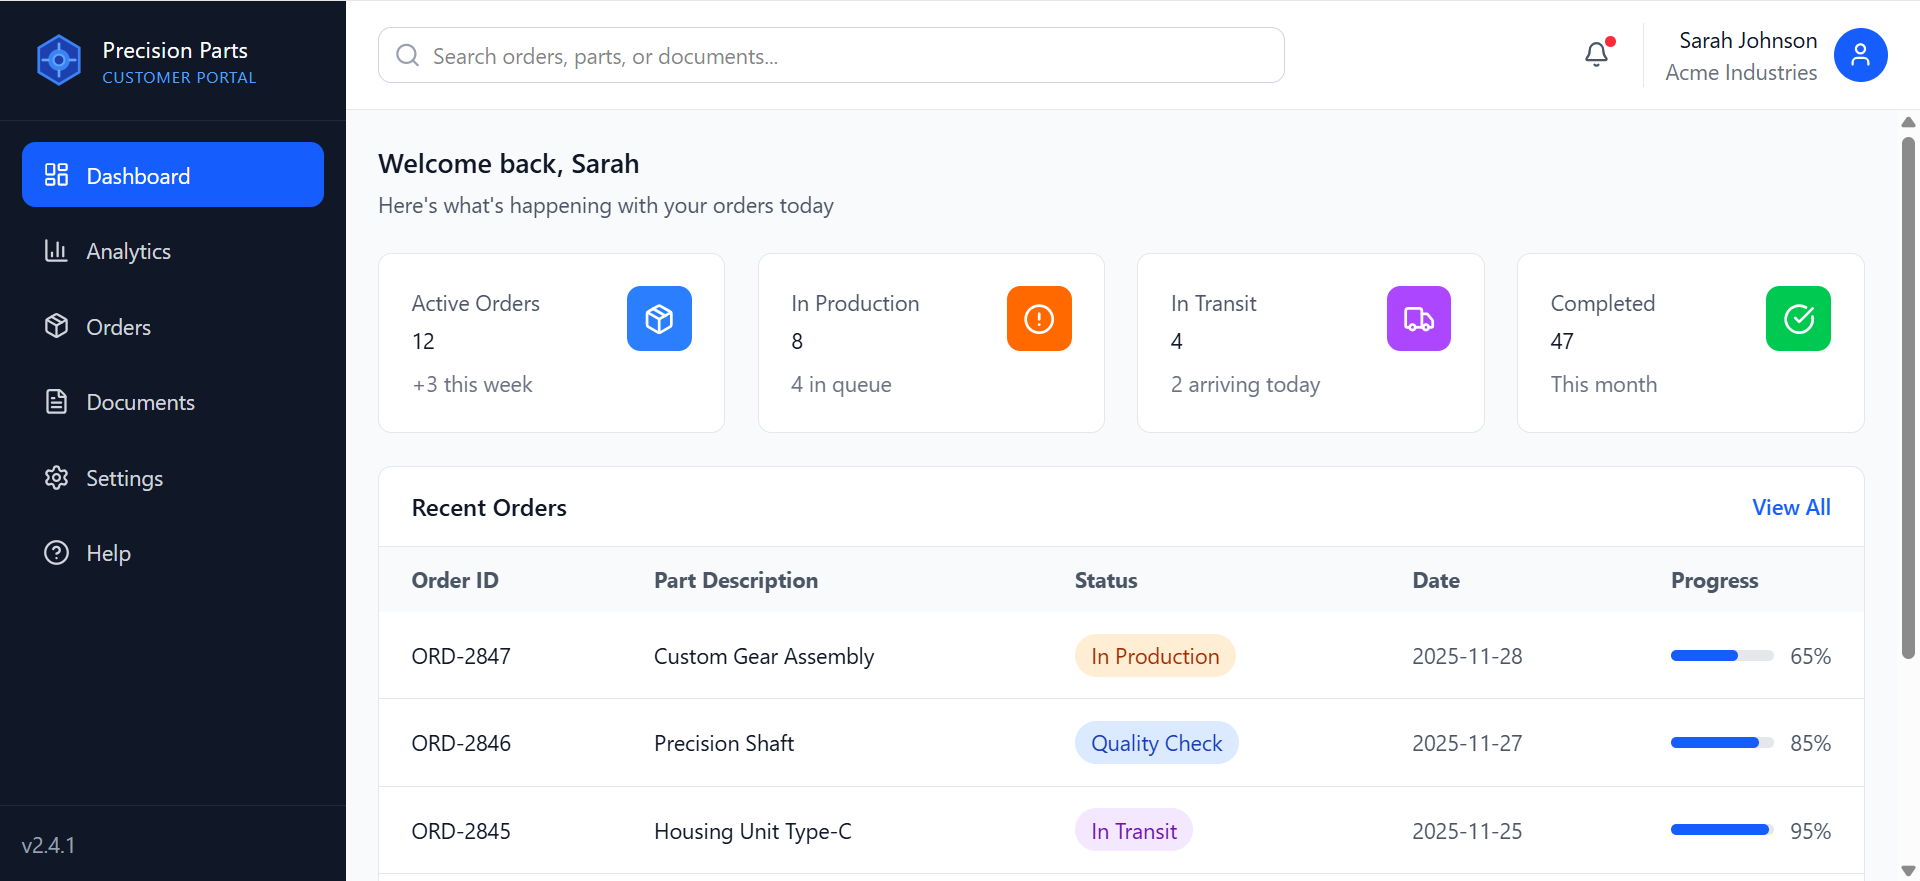
Figure 6: A Customer Self-Service Portal for a Parts Manufacturer
4) Turning Website Tracking Data into Revenue-Generating Intelligence
Every day, your corporate website is likely generating a ton of useful tracking data, but most of it gets logged to data files, never to be seen again. Tools like Google Analytics capture every click, search, scroll, add-to-cart, and remove-from-cart action, yet most organizations only scratch the surface by looking at high-level traffic metrics. The truth is, this “background noise” is actually a goldmine of insight into what customers want, where they're struggling to find what they're looking for, and what might persuade them to buy.
Take the example log file shown in Figure 7 below. At first glance, this semi-structured data doesn’t look particularly helpful — it’s a list of event names, timestamps, product IDs, and search terms. But once it’s consolidated and modeled inside Microsoft Fabric, it becomes a powerful way to understand how customers interact with your catalog. Every event becomes a clue: which products customers view most frequently, which items get added to the cart but rarely purchased, and where they abandon sessions entirely.
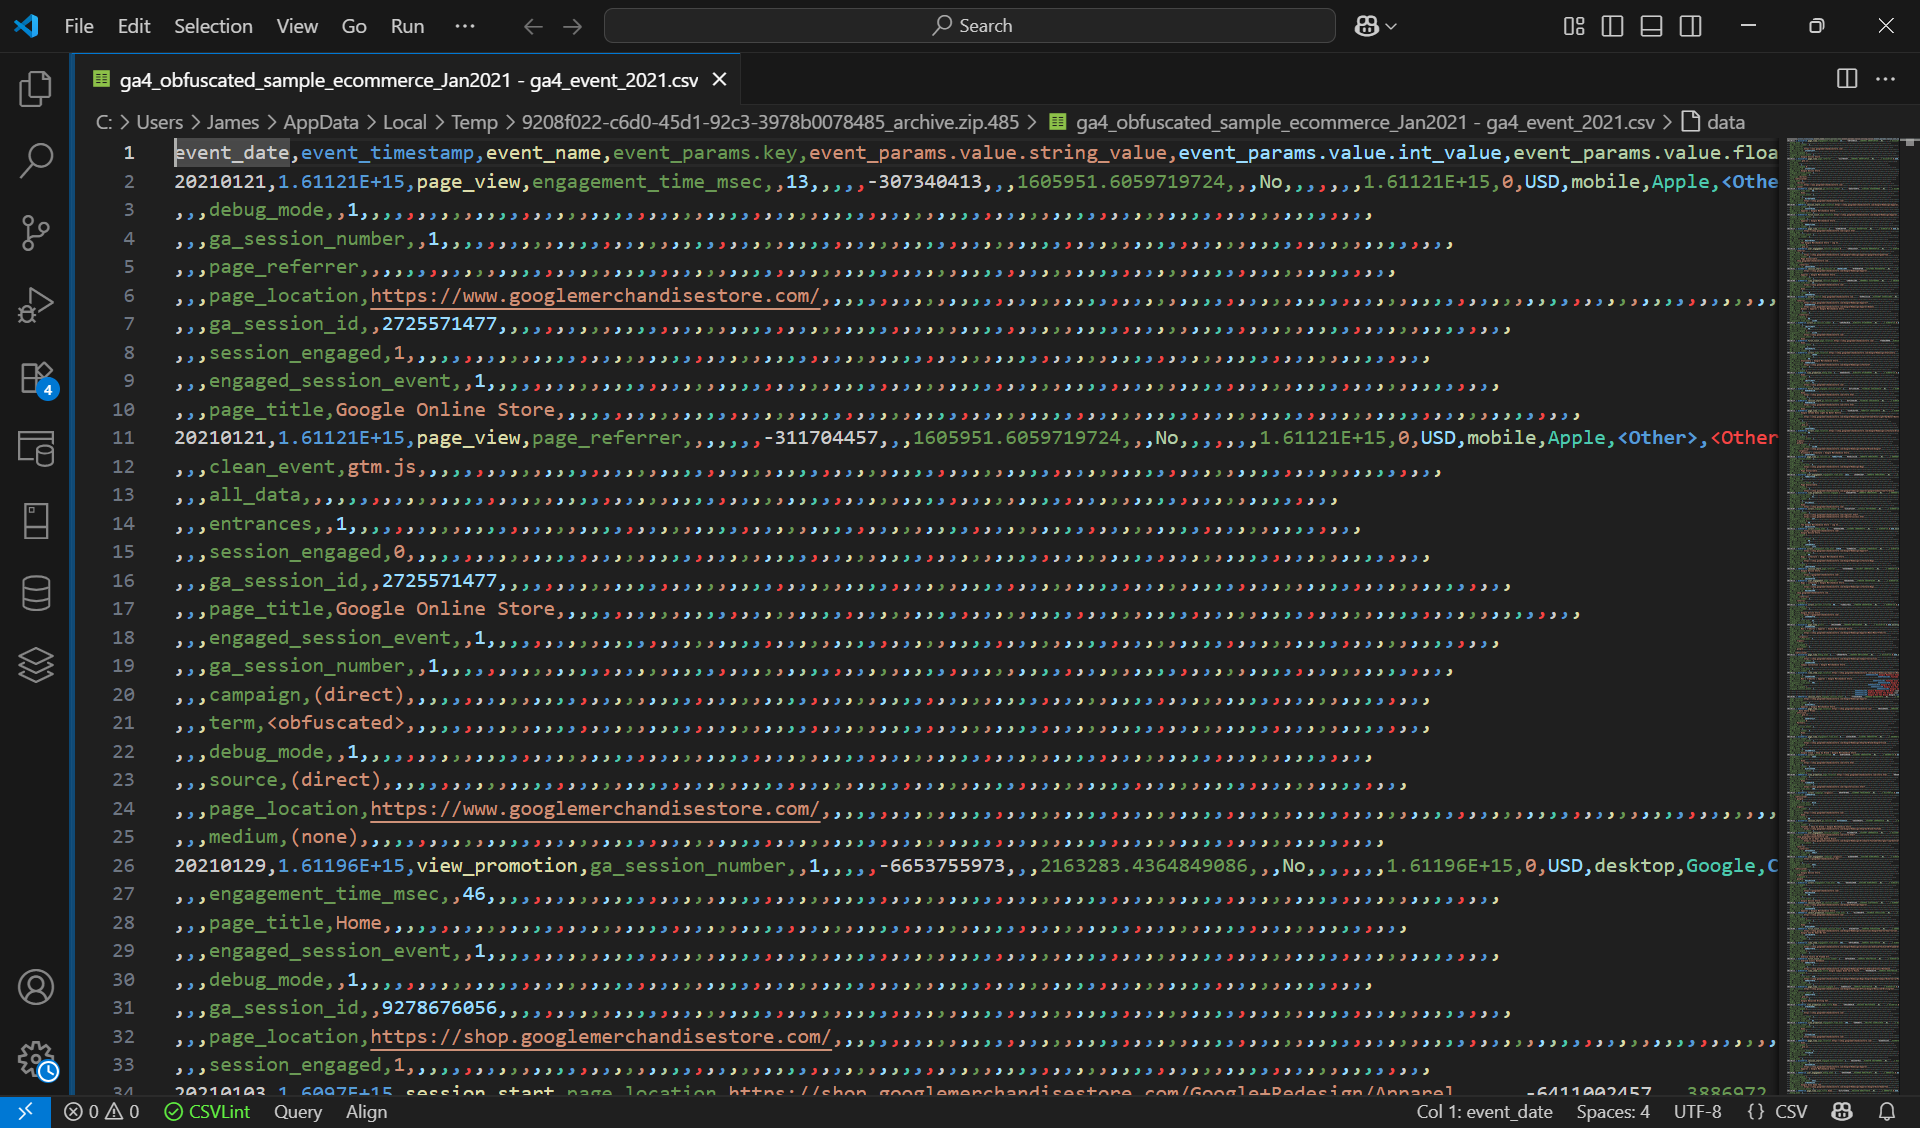
Figure 7: Working with Semi-Structured Data from Google Analytics
With Fabric Data Science, we can analyze patterns in add-to-cart and remove-from-cart activity to identify products with high interest but low conversion. We can dig into search history to surface zero-result queries, revealing missed opportunities or potential inventory gaps. We can even correlate these behavioral signals with supply chain or sales data to forecast demand and refine merchandising strategies.
In other words, the same tracking data that once sat untouched in an analytics tool can now fuel revenue-generating intelligence — helping you understand customer intent, improve product availability, and ultimately grow your bottom line.
5) Transforming Documents, Images, and PDFs into Usable Data
As we observed in the previous section, not all valuable data lives in a database. In many organizations, some of the most important information is buried inside documents, emails, PDFs, images, call transcripts, and even handwritten notes. Historically, this kind of unstructured content was nearly impossible to analyze at scale, but modern AI tools are changing that.
Using tools like Fabric Data Factory and Azure AI Foundry, we can automatically extract meaningful data from all kinds of unstructured sources — from scanned invoices and equipment photos to customer emails and support transcripts. This data integration pipeline is visualized in Figure 8 below. Once this information is parsed, cleaned, and standardized, it can be fed into a centralized knowledge base that becomes far more powerful than the original raw files.
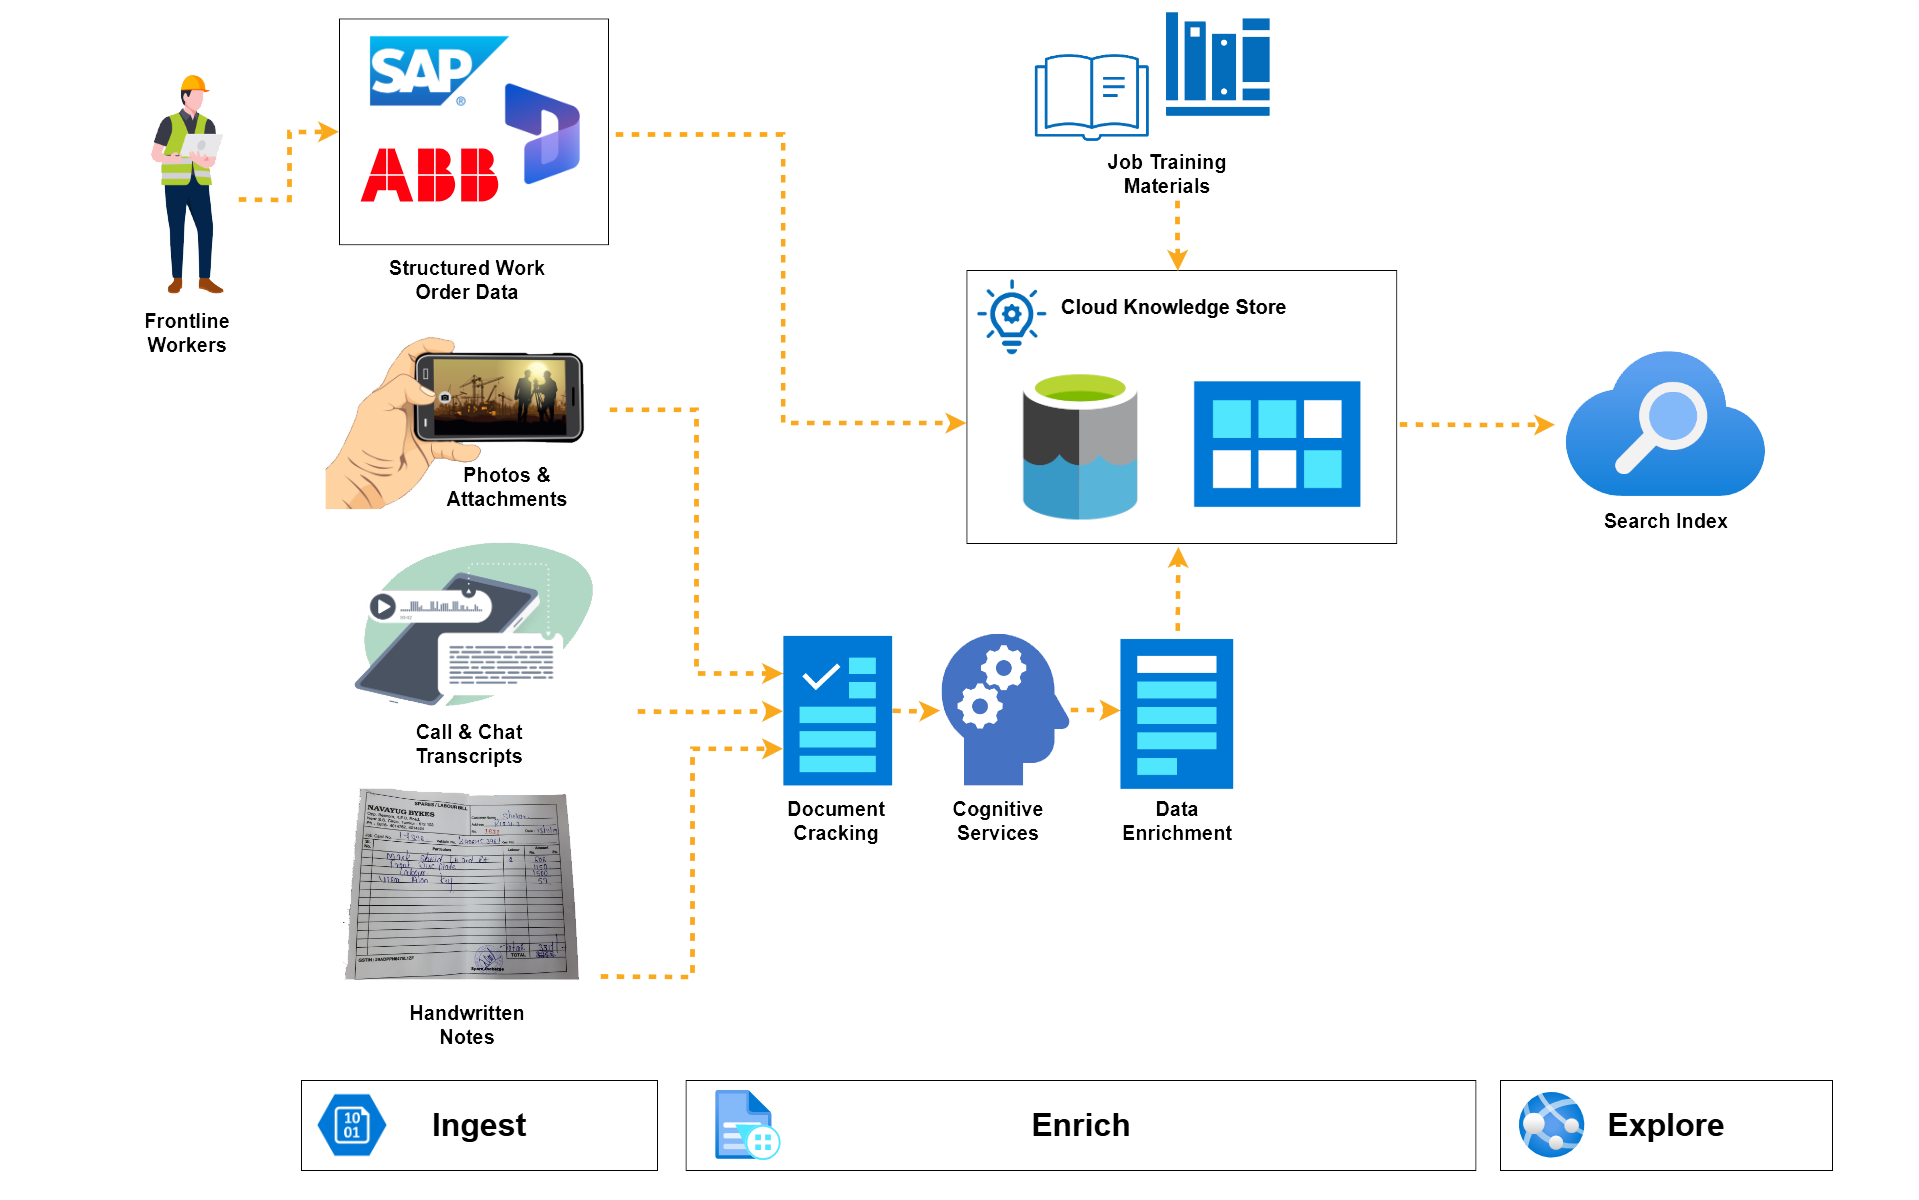
Figure 8: Extracting Insights from Documents and Images
Once that knowledge base exists, the possibilities really open up. From here, we can build custom AI agents that can answer questions, troubleshoot issues, summarize customer interactions, flag anomalies, or surface insights that would have otherwise remained hidden in a file share. It’s a transformative shift: unstructured content becomes structured intelligence, ready to be searched, analyzed, and put to work across the business.
6) Bridging the Gap Between IT Systems and the Real World
Most organizations rely heavily on their ERP, CRM, and line-of-business systems to understand what’s happening inside the business. But some of the most valuable insights emerge when you combine this internal data with what’s happening outside the business. By layering in real-world context — things like weather patterns, economic signals, or local market activity — you can uncover trends and opportunities that simply don’t show up in transactional reports.
Take a manufacturer of construction materials as an example. Their ERP system contains rich sales history and product data, while their CRM holds customer and distributor demographics. On their own, these systems can tell you who buys what and when. However, they probably can't tell you why demand spikes in some regions and lags in others. By bringing in freely available weather data from the National Oceanic and Atmospheric Administration (NOAA) and blending it with their sales and customer data inside Microsoft Fabric, we can start to run data science experiments that reveal deeper and more intricate patterns.
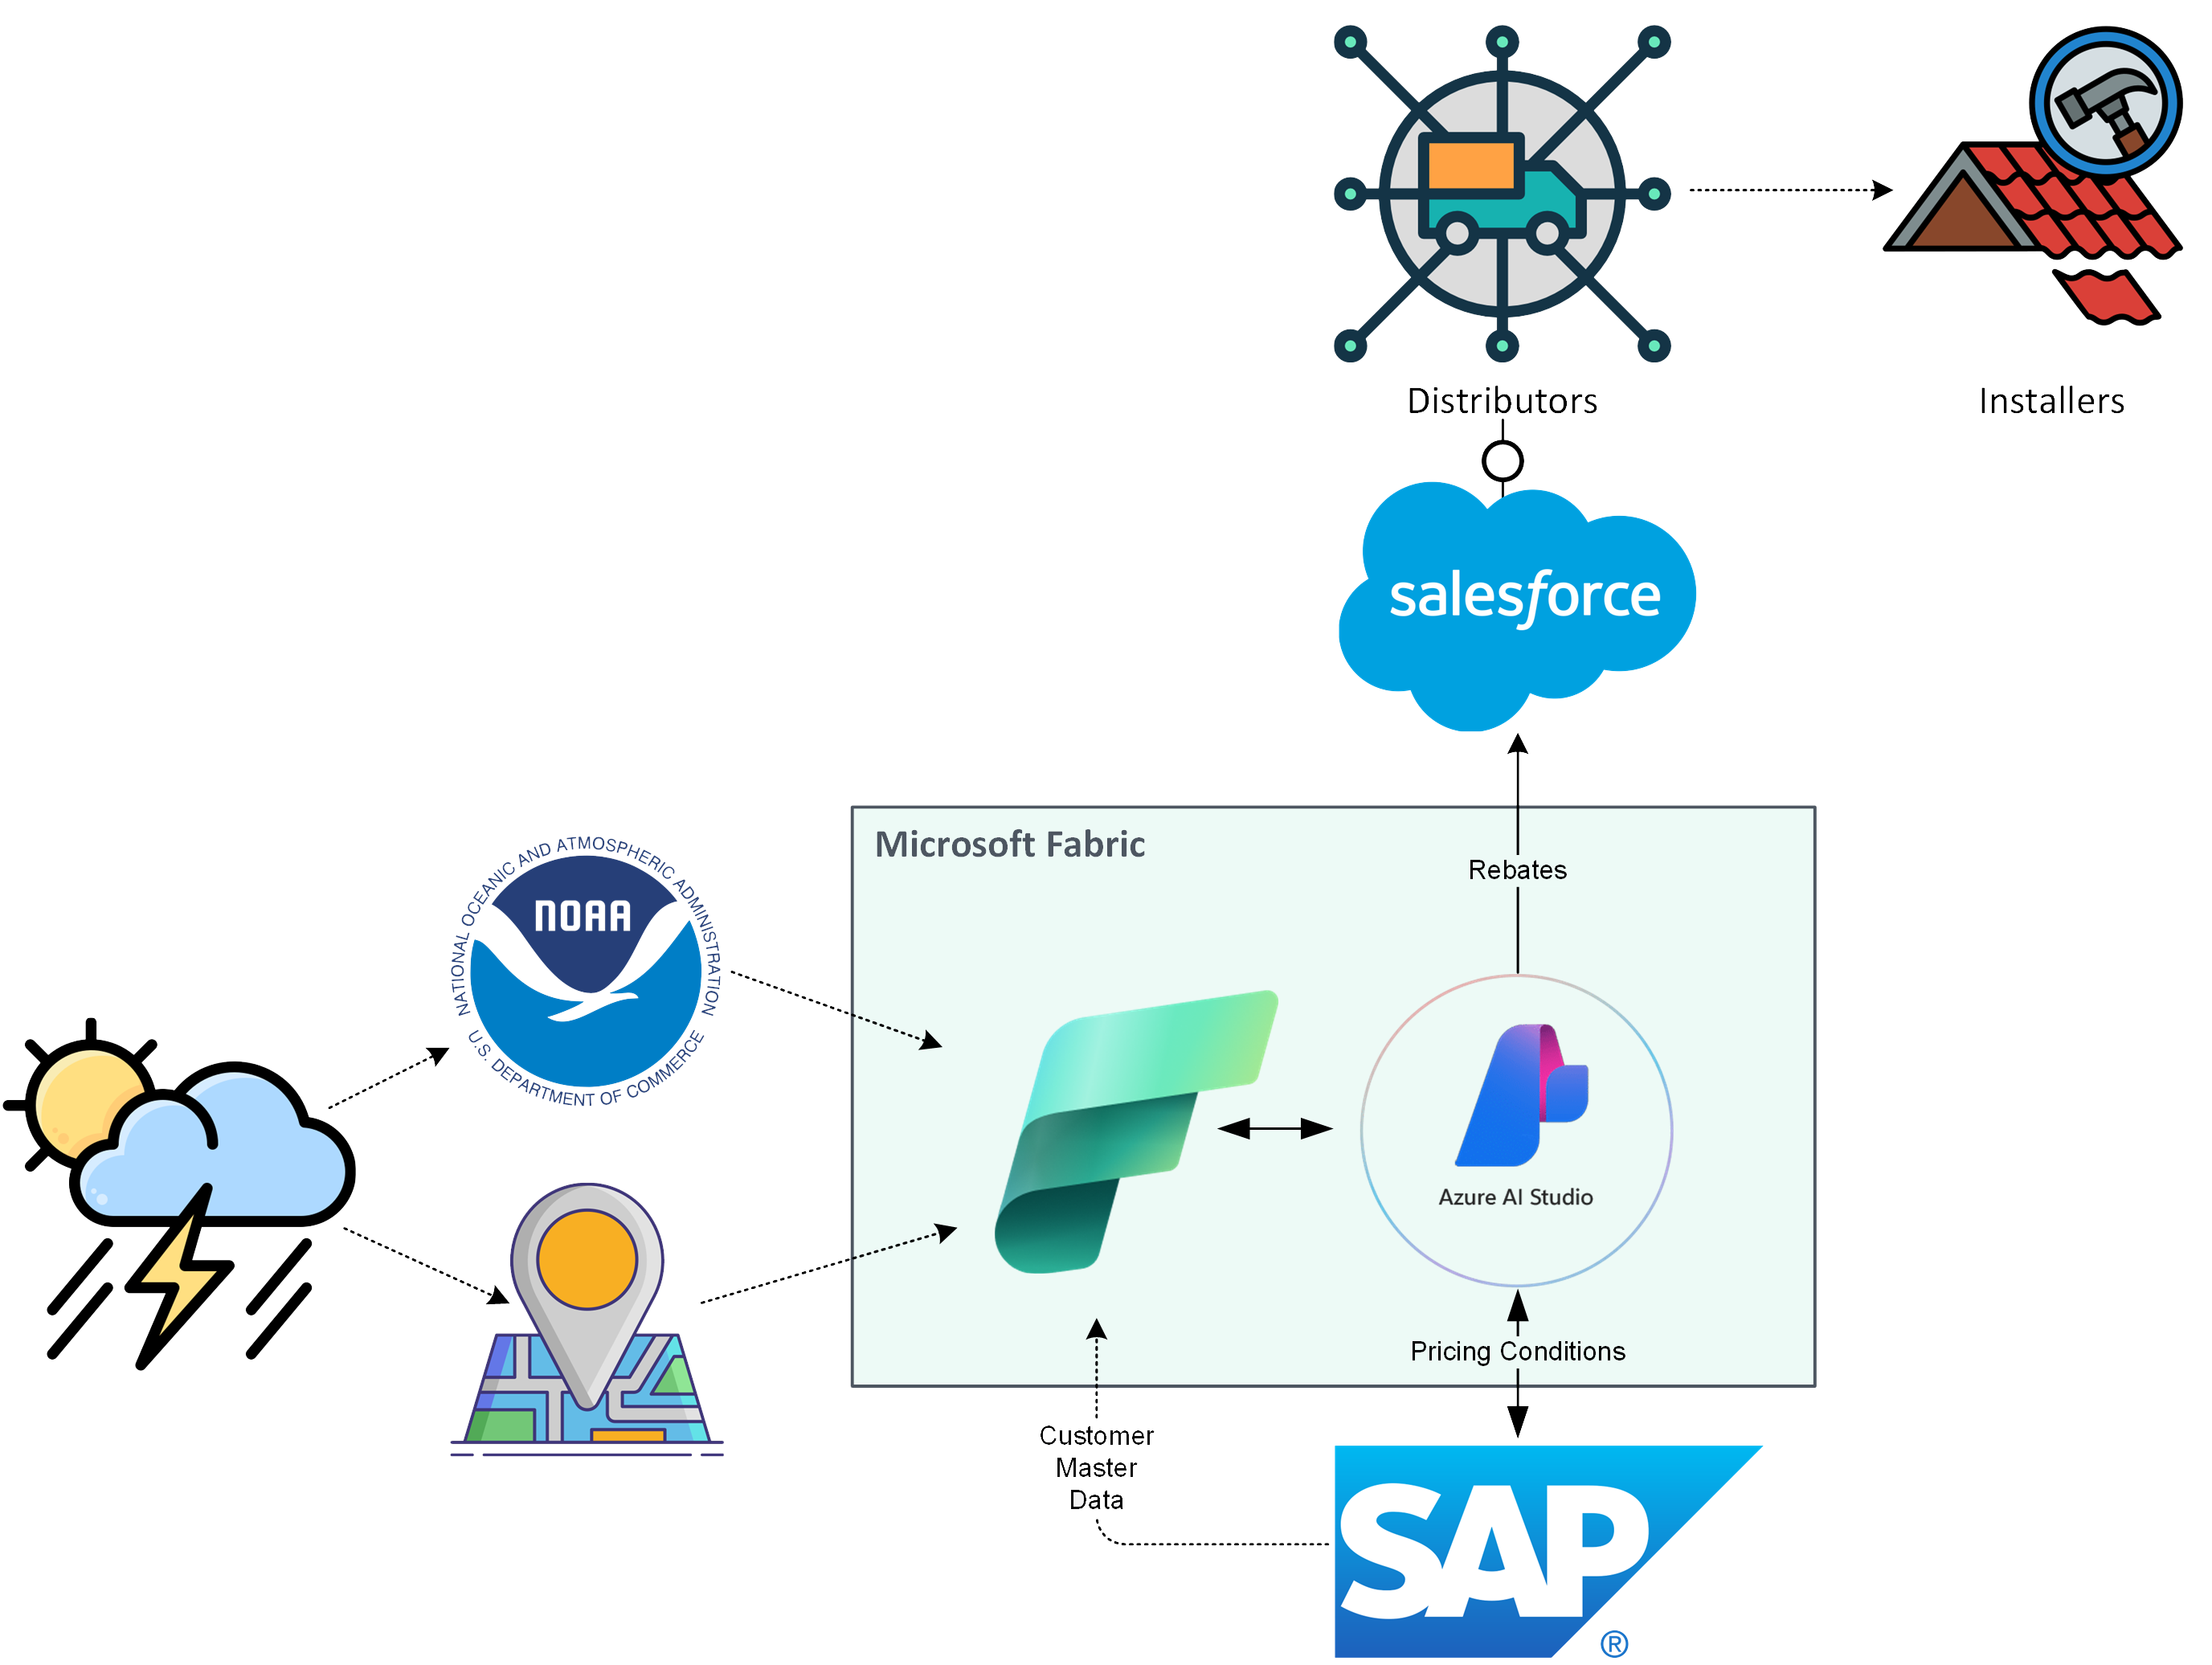
Figure 9: Combining Weather Event Data with LOB System Data to Make Intelligent Recommendations for Rebates
Maybe certain building products sell faster in regions recovering from heavy storm activity. Maybe distributors in hurricane-prone areas consistently reorder specific materials after intense weather events. By correlating weather events with historical purchasing behavior, we can help the manufacturer anticipate demand, target marketing campaigns more effectively, and even guide distributors toward the products they’re most likely to need next.
This kind of inside-meets-outside analysis gives you a clearer view of the real-world forces that influence your business. It turns traditional reporting into truly predictive intelligence, helping your teams make smarter, more timely decisions based on what’s happening both in their systems and in the world around them.
7) Predicting What’s Next with AI-Driven Forecasting
Once data is consolidated in OneLake, we can do far more with it than just analyze what has already happened. With tools like Fabric Data Science, it's a surprisingly straightforward exercise to build AI models that classify patterns, identify trends, and predict what’s likely to come next. These models can be trained on the very same datasets you’re already using for reporting: sales activity, operational metrics, customer behavior, and inventory levels to turn familiar data into forward-looking intelligence.
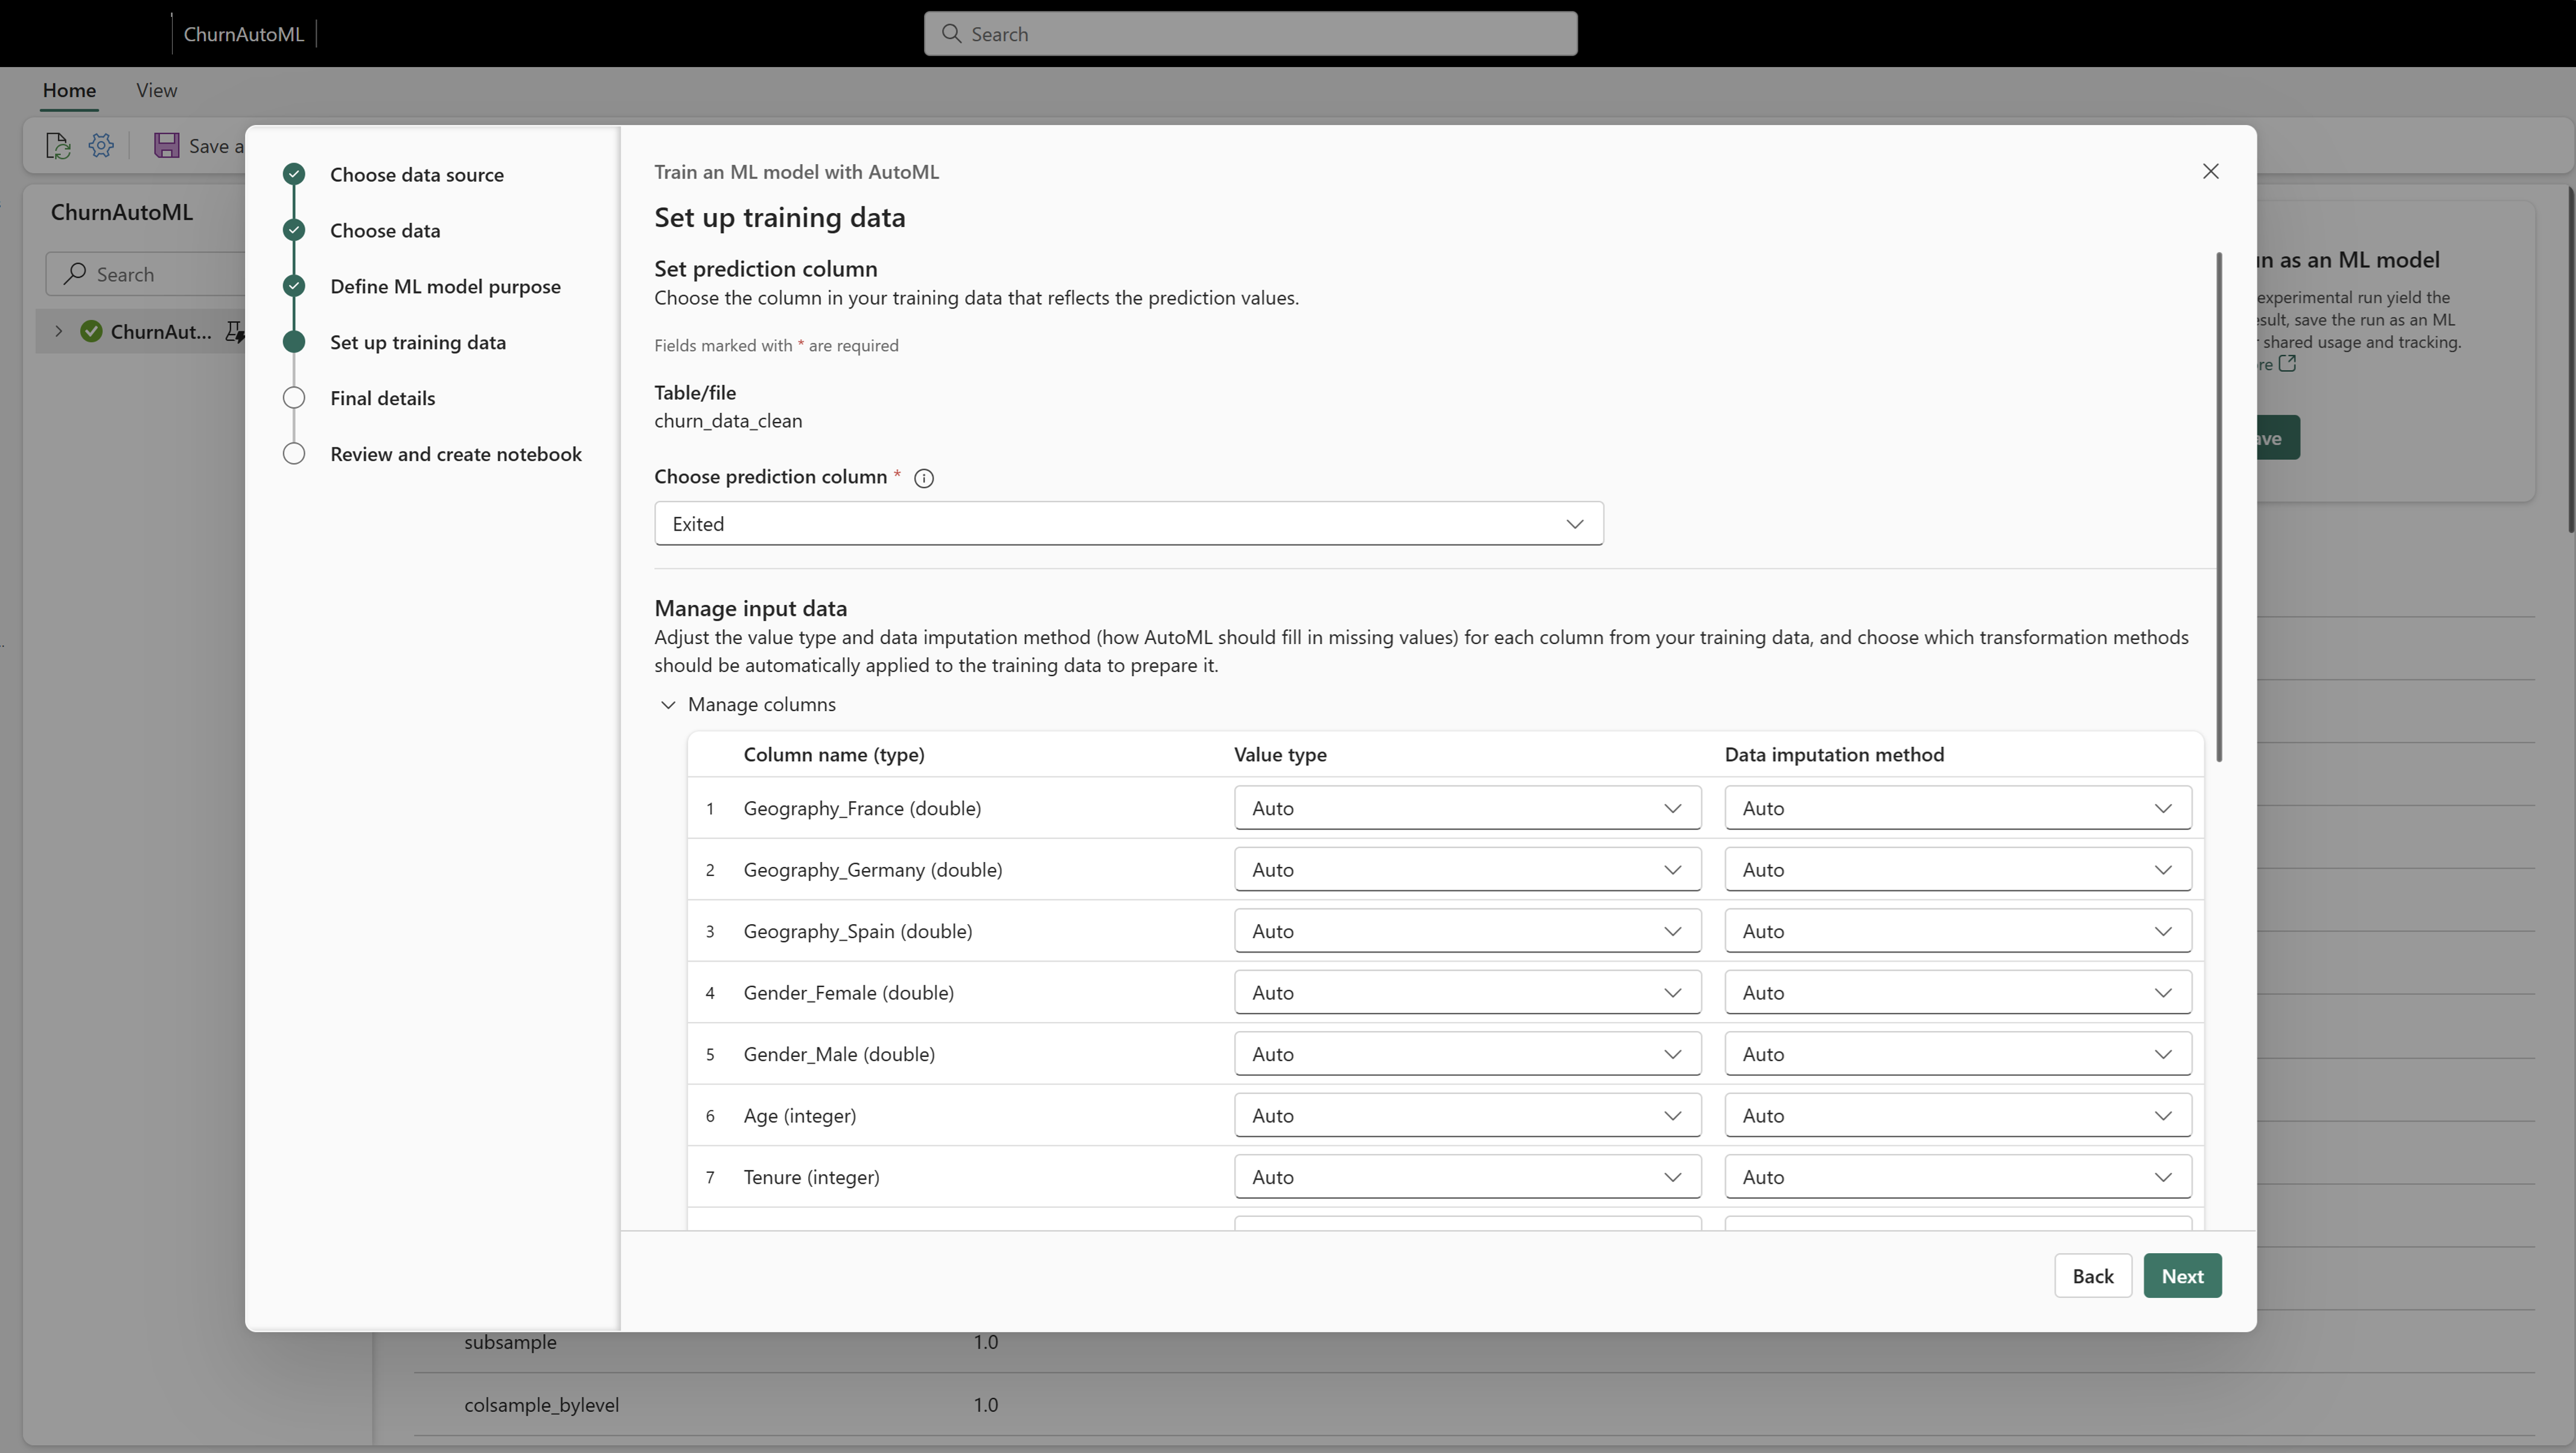
Figure 10: Building an AI-Driven Forecast Using Fabric & AutoML
What makes these models especially powerful is that they go beyond producing simple one-off forecasts. We can use them to simulate different future scenarios, test assumptions, and explore “what if” situations before making big decisions. Want to understand how a change in pricing, a shift in demand, or a supply chain disruption might impact your business? An AI model can generate multiple possible outcomes and help you choose the best path forward.
AI-driven forecasting gives you the ability to stay ahead rather than react. It equips teams with the confidence they need to plan proactively, allocate resources more effectively, and make decisions rooted in data instead of guesswork.
8) Interactive Dashboards for Actionable Outcomes
What if your dashboards could do more than just show you data? What if they could help you get things done? With Power BI’s new translytical task flows feature, that possibility is no longer a what-if. Instead of treating dashboards as read-only windows into your business, you can use them as control panels where decisions made in response to what you see are executed immediately, without switching tools or applications.
To put this into perspective, consider the sales opportunities dashboard shown in Figure 11 below. In this scenario, sales reps are able to review open opportunities and take action in real time. For example, let's say that a sales rep believes that offering a discount could be the difference in closing a deal. Instead of leaving the dashboard and going off to request the discount, they can use the built-in form to fill in their discount request and submit it directly from within the report.
Figure 11: Updating a Sales Opportunity Directly in a Power BI Report
As you can see in Figure 11, this particular request is routed in real-time to a supervisor that's alerted in Microsoft Teams, enabling them to respond naturally within the flow of work.
The main benefit of this approach is that it blurs the line between analytics and operations. Dashboards stop being passive views and become dynamic, operational tools that accelerate decision cycles, reduce friction, and shorten the time from insight to impact. Instead of building reports and exporting data just to react, you can handle issues and opportunities right as they appear, with full context and minimal overhead.
9) Turning Insight into Immediate Action
One of our customers is fond of saying that a "report is only as useful as the action it inspires". While this is undoubtedly true, what if we could just skip the part where a human being has to run a report and let the system respond to issues as/when they occur?
With Fabric Real-Time Intelligence, we can do that very thing by keeping a constant finger on the pulse of what’s happening across the enterprise. Whether it’s a new transaction hitting your ERP, an important business event being logged, or a machine signaling a potential failure on the shop floor, Real-Time Intelligence can monitor these signals the instant they occur.
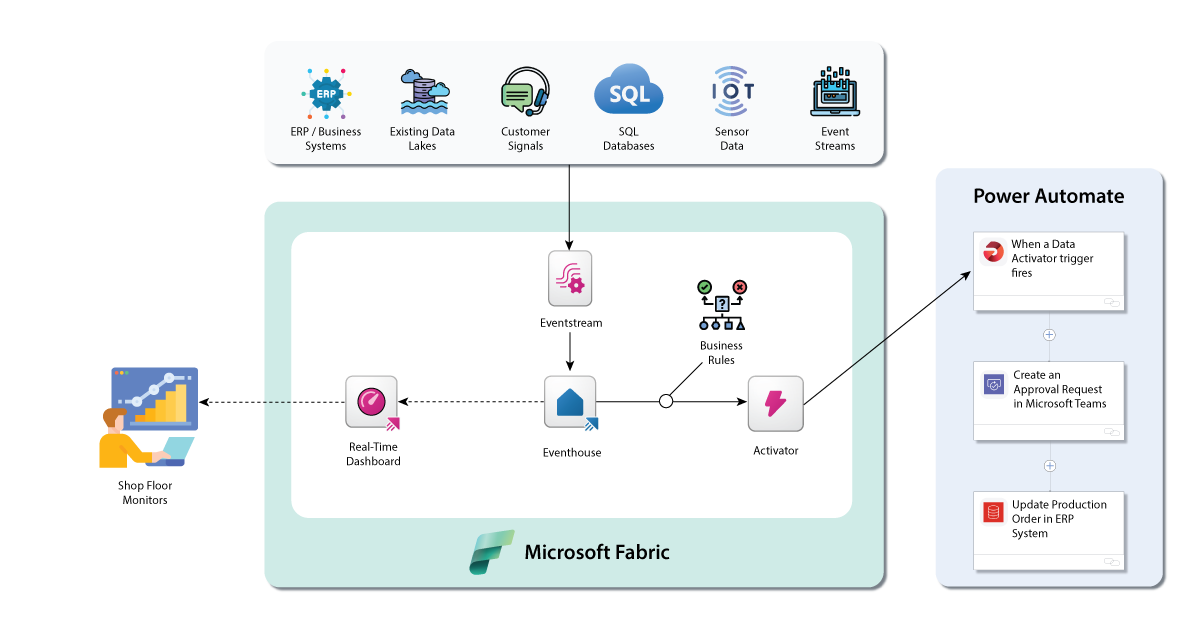
Figure 12: Working with Real-Time Intelligence in Microsoft Fabric
As you can see in Figure 12 above, what makes this capability so powerful is the flexible rules engine built directly into the platform. You can define rules that specify exactly what should happen when certain conditions are met — from simple threshold checks to complex combinations of events. And those rules can trigger a wide range of automated actions: a straightforward email or Teams alert to notify someone, or a fully autonomous workflow that takes corrective action on its own by executing a series of coordinated tasks across multiple systems.
This shift from passive monitoring to real-time response enables you to resolve issues faster, reduce downtime, and stay ahead of potential problems before they escalate. It’s the difference between seeing an alert after the fact and having a system that acts the moment something needs attention, turning insight into immediate action.
10) Building Always-On Intelligence with Agentic AI
One of the most exciting capabilities emerging from Microsoft Fabric lately is the introduction of Data Agents. As the name suggests, data agents are intelligent, autonomous assistants that can be trained on your business data just like you would train a new analyst joining the team. Instead of starting from scratch, data agents learn how your processes work, how your data should be interpreted, and what kinds of complex questions leaders typically ask when evaluating performance.
As you can see in Figure 13, while data agents naturally understand technical data models in Fabric, they can be further trained by business analysts that can coach the agent on how data is interrelated on a functional basis, how the business thinks about or interprets different data points, etc. The end result is more than just a chatbot interface to convert natural language queries into SQL — these agents can think and reason over the data to carry on highly complex conversations about the data from a non-technical business perspective.
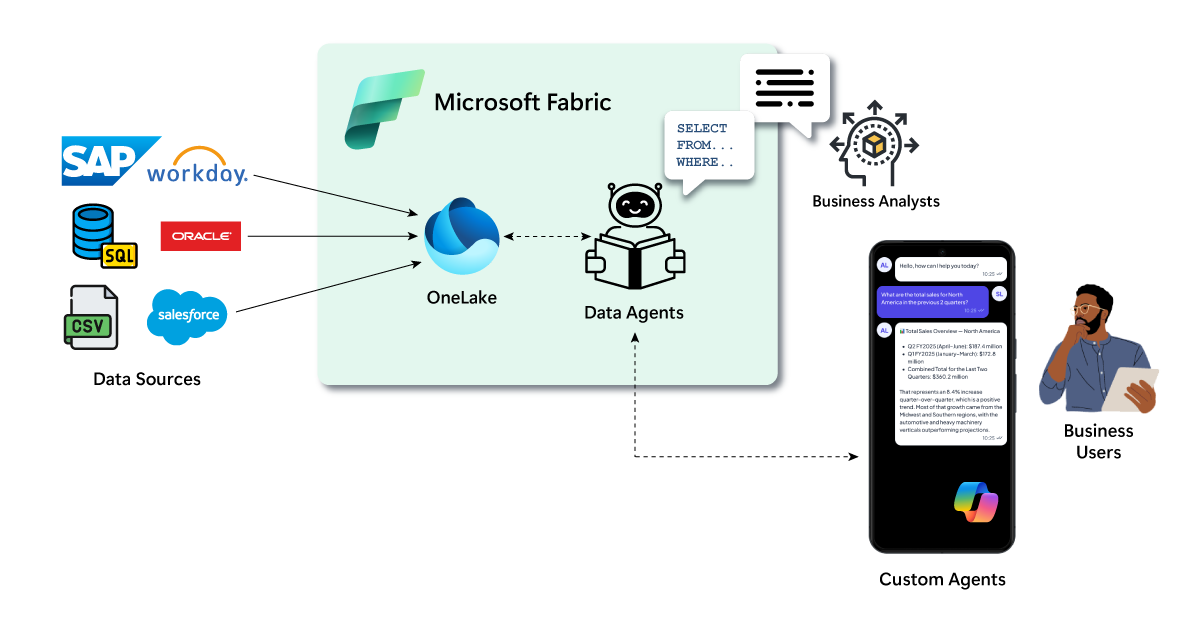
Figure 13: Building Data Agents in Microsoft Fabric
This training investment pays off quickly. If you're like most organizations, you're probably struggling with generational knowledge transfer. After all, it takes a LOT of training to convey the subtle, experience-based understanding of why things operate a certain way, what specific metrics mean in practice, and how to interpret trends in the right business context. Fabric data agents help bridge that gap by capturing institutional knowledge and making it instantly accessible. They become an “always-on” analyst that never sleeps, never forgets, and is always up to speed on the latest data.
Closing Thoughts
The possibilities we’ve explored in this article all point to a simple truth: you probably already have all the data you need to operate smarter, faster, and more confidently. The real opportunity lies in moving beyond traditional reporting and tapping into the full spectrum of modern data capabilities — from consolidation and real-time intelligence to AI-driven forecasting, agentic automation, and interactive dashboards that turn insight into action. When these tools come together inside a unified platform like Microsoft Fabric, they unlock a level of clarity and efficiency that simply wasn’t possible a few years ago.
Hopefully the examples we demonstrated whet the appetite for what's possible, but getting started doesn't mean that you need to overhaul every system at once. Instead, we recommend taking a more thoughtful, step-by-step approach to break down data silos, modernize workflows, and empower teams with the tools they need to act on information in meaningful ways.
With the right foundation in place, everyday data becomes a strategic asset that can fuel better decisions, improve customer experiences, and build a more resilient, future-ready organization.